

Key Takeaways
- Arbitrum (ARB) predictions suggest a potential high of $0.82 by 2025.
- By 2027, ARB’s price is expected to range between $1.01 and $1.22, averaging $1.04.
- Projections indicate ARB could reach between $2.98 and $3.51 in 2030, with an average of $3.08.
Layer 2 scaling solutions have recently garnered significant attention due to high network activity. Arbitrum, an Optimistic Rollup solution, has emerged as a leader in this space, boasting a total value locked (TVL) of $2.53 billion. Arbitrum enhances network operations by processing them off the Ethereum mainnet while preserving Ethereum’s robust security standards.
The recent launch of Arbitrum’s BOLD testnet marks a significant step towards decentralization. Upon integration into the mainnet, this update will allow for permissionless validation, enabling anyone to challenge the network’s state, a contrast to the current system requiring explicit allow-listing for validators.
Is Arbitrum a Promising Investment?
Considering these developments, many are asking about Arbitrum’s investment potential. Will ARB’s price increase? What are the long-term prospects for the asset over the next five years? This Arbitrum price prediction aims to address these questions.
Arbitrum Overview
| Cryptocurrency | Arbitrum |
| Ticker | ARB |
| Current Price | $0.2634 |
| Market Cap | $1.45 Billion |
| Trading Volume | $179.55 Million |
| Circulating Supply | 5.5 Billion |
| All-Time High | $2.40 (January 12, 2024) |
| All-Time Low | $0.136 (October 11, 2025) |
| 24-Hour High | $0.2711 |
| 24-Hour Low | $0.2558 |
Technical Analysis of Arbitrum’s Price
| Metric | Value |
| Volatility (30-day variation) | 13.04% |
| 50-day SMA | $0.3717 |
| 200-day SMA | $0.4028 |
| Sentiment | Bearish |
| Green Days (30 days) | 15 (50%) |
| Fear and Greed Index | 27 (Fear) |
Arbitrum Price Analysis
As of October 27, Arbitrum’s price saw a 2.47% increase over 24 hours, reaching $0.2632. However, it remained down 40.94% over the past 30 days, indicating significant volatility. Trading volume also decreased by 47.75% in the same period. Earlier in the month, ARB experienced a sharp decline, hitting its lowest price since launch at $0.136.
ARB 1-Day Chart Analysis

Following a breach of critical support at $0.41, which led to a new all-time low, ARB now has support at $0.25. The cryptocurrency is trading below all major Simple Moving Average (SMA) and Exponential Moving Average (EMA) levels. The MACD histogram, at -0.0011, suggests a potential rise in positive momentum, while the Relative Strength Index (RSI) at 34.73 indicates a recovery from oversold territory (typically below 30).
Arbitrum Price 4-Hour Chart Analysis

Analysis of the 4-hour chart reveals positive momentum for ARB, with declining volatility. The short candles suggest market indecision. MACD histograms indicate that positive momentum has decreased over the past eight hours.
Arbitrum Technical Indicators: Levels and Action
Daily Simple Moving Average (SMA)
| Period | Value ($) | Action |
| SMA 3 | 0.3444 | SELL |
| SMA 5 | 0.3259 | SELL |
| SMA 10 | 0.3330 | SELL |
| SMA 21 | 0.3145 | BUY |
| SMA 50 | 0.3717 | SELL |
| SMA 100 | 0.4280 | SELL |
| SMA 200 | 0.4028 | SELL |
Daily Exponential Moving Average (EMA)
| Period | Value ($) | Action |
| EMA 3 | 0.3298 | SELL |
| EMA 5 | 0.3627 | SELL |
| EMA 10 | 0.4128 | SELL |
| EMA 21 | 0.4511 | SELL |
| EMA 50 | 0.4513 | SELL |
| EMA 100 | 0.4315 | SELL |
| EMA 200 | 0.4496 | SELL |
Future Outlook for ARB Price Analysis
Arbitrum is currently affected by a broader risk-off market sentiment. However, the resilience shown by other Ethereum L2 solutions like Mantle suggests that Arbitrum’s performance may not be solely dependent on its specific blockchain.
Factors Influencing ARB’s Price
Speculation surrounding Arbitrum’s potential involvement in Robinhood’s blockchain initiatives has intensified. A recent event in Cannes revealed that Robinhood might leverage Arbitrum’s infrastructure for its European tokenized stock trading platform, potentially allowing EU users to trade tokenized U.S. stocks.
Recent Developments
Robinhood has expanded its European tokenized stock offerings to include nearly 500 U.S. equities and ETFs, all facilitated by Arbitrum. These tokens are regulated under MiFID II, enabling 24/7 fractional trading with a low fee of 0.1%.
Arbitrum’s Long-Term Viability
The long-term success and sustainability of any blockchain network are heavily reliant on its adoption rate. Arbitrum’s current performance in user adoption serves as a positive indicator for its future, even amidst recent price fluctuations.
Is Arbitrum a Good Buying Opportunity?
Arbitrum is currently trading within its yearly low range, with technical indicators suggesting it is positioned just above oversold levels. At its current valuation, ARB appears undervalued and could potentially rebound if market sentiment shifts favorably.
💡 Furthermore, the total value locked within the Arbitrum ecosystem has surpassed $2.5 billion, demonstrating strong utility within decentralized finance (DeFi).
Arbitrum as an Investment
The launch of SkyEcosystem’s USDS stablecoin on Arbitrum further expands the network’s utility and is expected to attract increased liquidity. This integration could lead to greater ARB token usage and a subsequent positive impact on its price.
Will Arbitrum Reach $10?
Based on current projections, it is unlikely that Arbitrum (ARB) will reach the $10 mark before 2031.
Can Arbitrum Reach $100?
According to projections, Arbitrum (ARB) is not expected to trade at $100 within the period ending in 2031.
Will Arbitrum Reach $1,000?
Projections suggest that Arbitrum (ARB) is unlikely to reach $1,000 by 2031.
Arbitrum’s Long-Term Future
A high adoption rate is fundamental to the long-term success and sustainability of any blockchain. Arbitrum’s performance in this regard offers a positive outlook for its future, despite recent price declines.
ARB Price Prediction: November 2025
The Arbitrum price forecast for November 2025 anticipates a low of $0.3521, an average of $0.4409, and a high of $0.5940.
| Month | Potential Low ($) | Potential Average ($) | Potential High ($) |
| November | 0.3521 | 0.4409 | 0.5940 |
Arbitrum Price Prediction: 2025
For the year 2025, Arbitrum’s (ARB) price is projected to trade within a range of $0.295 to $0.820, with an average price of $0.490.
| Year | Potential Low ($) | Potential Average ($) | Potential High ($) |
| 2025 | 0.2950 | 0.4900 | 0.8200 |
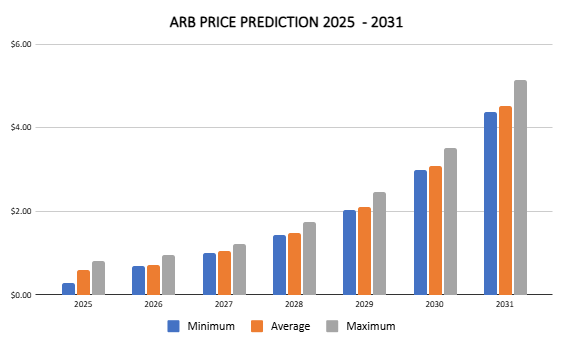
Arbitrum Price Predictions: 2026 – 2031
| Year | Potential Low ($) | Potential Average ($) | Potential High ($) |
| 2026 | 0.6984 | 0.7260 | 0.9500 |
| 2027 | 1.0100 | 1.0400 | 1.2200 |
| 2028 | 1.4400 | 1.4900 | 1.7500 |
| 2029 | 2.0300 | 2.1000 | 2.4700 |
| 2030 | 2.9800 | 3.0800 | 3.5100 |
| 2031 | 4.3700 | 4.5200 | 5.1400 |
Arbitrum (ARB) Price Prediction 2026
The year 2026 is also expected to be bullish for Arbitrum. Our analysis forecasts a price range between $0.698 and $0.950, with an average price of $0.726.
Arbitrum Price Prediction 2027
Arbitrum’s market price is predicted to climb further into 2027. For this year, ARB’s price is expected to range between $1.01 and $1.22, averaging $1.04.
Arbitrum Coin Price Prediction 2028
Our analysis suggests a continued acceleration in ARB’s price trajectory. It is anticipated to trade between $1.44 and $1.75, with an average price of $1.49.
Arbitrum Price Prediction 2029
The ARB price prediction for 2029 indicates a trading range between $2.03 and $2.47, with an average price of $2.10.
ARB Price Prediction 2030
The ARB price prediction for 2030 estimates an expected price range of $2.98 to $3.51, with an average of $3.08.
Arbitrum Price Prediction 2031
The Arbitrum price forecast for 2031 projects a high of $5.14, a minimum price of $4.37, and an average price of $4.52.
Analyses of ARB Market Price Predictions
| Platform | 2025 | 2026 | 2027 |
| Digitalcoinprice | $0.64 | $0.77 | $1.07 |
| Coincodex | $0.90 | $0.64 | $0.34 |
| Gate.io | $0.31 | $0.38 | $0.47 |
Cryptopolitan’s ARB Price Prediction
Our projections indicate that ARB could reach a high of $0.82 in 2025. By 2027, the price is expected to fluctuate between $1.01 and $1.22, with an average of $1.04. In 2030, ARB is forecast to trade between $2.98 and $3.51, averaging $3.08. Please note that these predictions are not financial advice. It is recommended to conduct your own thorough research or consult with an independent financial advisor.
Arbitrum Historic Price Sentiment
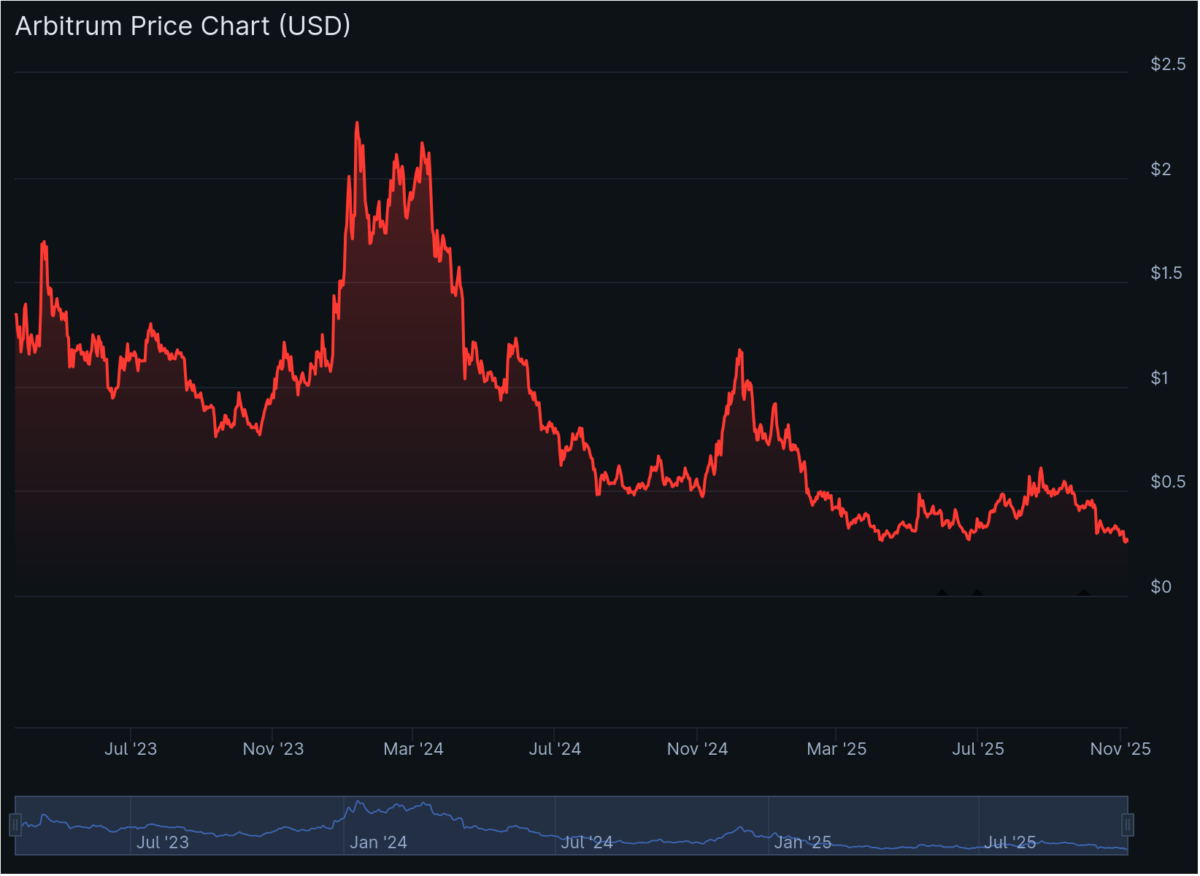
- The Arbitrum airdrop snapshot was taken on February 6, 2023, with eligible participants beginning to claim tokens on March 23, 2023. The claim period concluded on September 24, 2023.
- The airdrop allocated 11.5% of the total supply to eligible users, 1.1% to Arbitrum ecosystem DAOs, and 44% to employees and Offchain Labs investors, subject to lock-up and vesting schedules. The remaining portion was transferred to the Arbitrum DAO treasury.
- On September 11, 2023, ARB reached its all-time low of $0.7453.
- The Bitcoin halving event and crypto ETF optimism contributed to the coin’s recovery from October onwards. By year-end, it had risen to $1.4.
- This upward trend extended into 2024, with ARB reaching its all-time high of $2.40 on January 12.
- According to CoinMarketCap data, ARB fell below its initial listing price in June 2024.
- On August 5, 2024, a new all-time low of $0.4317 was recorded.
- Following this, the price recovered in September, reaching a high of $0.67.
- The bullish momentum continued through November, peaking at $1.12 in December.
- Entering 2025, ARB began trading at $0.72 before entering a bear run, dropping to a low of $0.40 in February. On April 3, 2025, Arbitrum hit a new all-time low of $0.2951.
- The cryptocurrency recovered later in the year, trading at $0.45 in October. By November, it had fallen to $0.26.
Final Thoughts on Arbitrum’s Potential
Arbitrum’s ecosystem continues to grow, marked by increasing adoption and the introduction of new functionalities. While short-term price movements can be volatile, the underlying technological advancements and ecosystem expansion suggest a positive long-term outlook.