

At a Glance
- AUD/USD showed minimal movement on Friday due to conflicting US economic data.
- Softer US inflation data initially pressured the US Dollar, but stronger business activity data provided support.
- US inflation (CPI) rose less than expected in September, increasing the likelihood of the Federal Reserve maintaining its current monetary policy.
- Meanwhile, US business activity showed resilience, with the S&P Global Composite PMI reaching a three-month high in October.
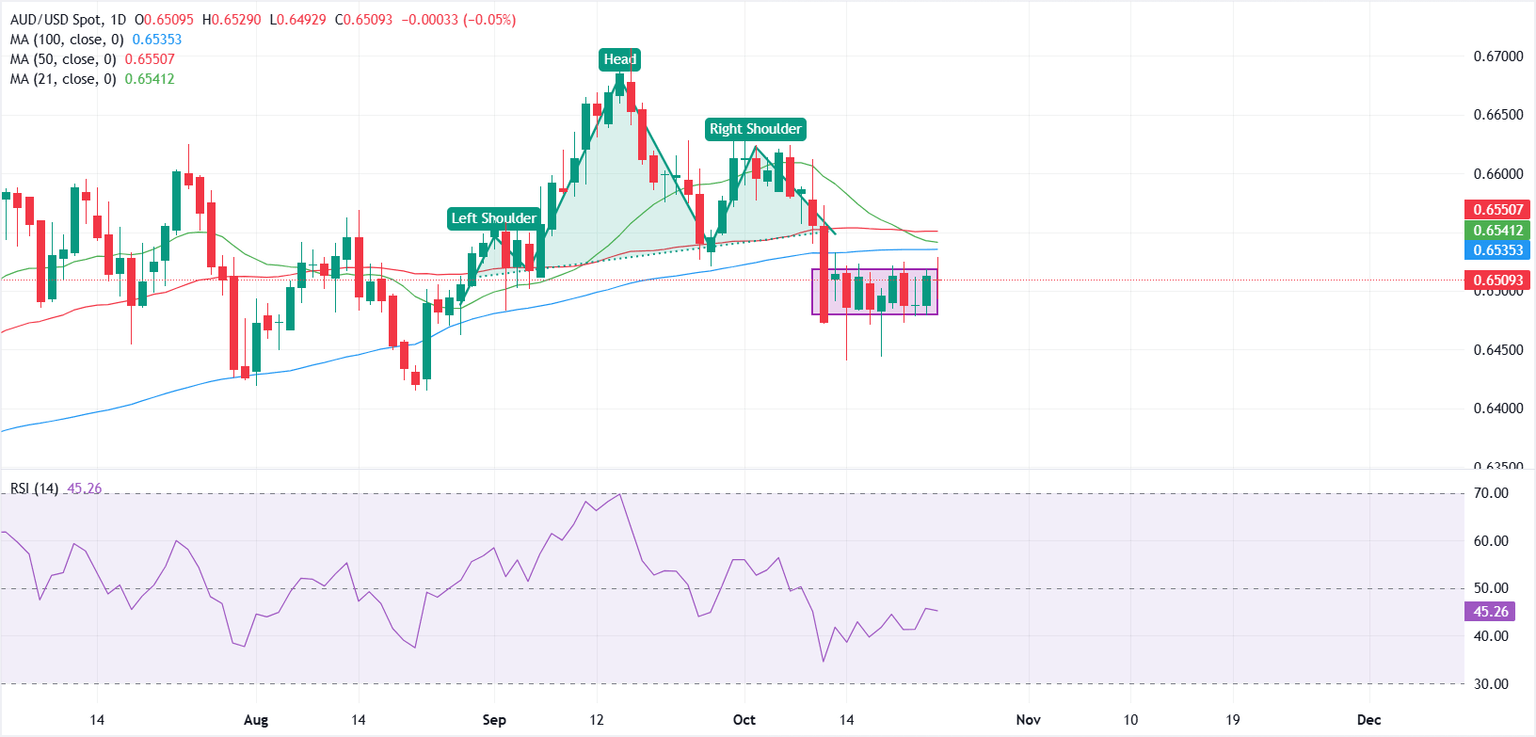
- Technical indicators suggest AUD/USD is trading within a tight range, with a slight bearish bias.
Australian Dollar (AUD) vs. US Dollar (USD) Holds Steady Amid Mixed Signals
The Australian Dollar (AUD) experienced negligible movement against the US Dollar (USD) on Friday, following a period of volatile trading influenced by a mixed bag of US macroeconomic releases. At the time of reporting, the AUD/USD pair was trading around the 0.6511 level. This stability came after earlier fluctuations, which were triggered by the release of key US economic indicators, including the Consumer Price Index (CPI) and the S&P Global Purchasing Managers’ Index (PMI).
The US Dollar initially faced downward pressure when US inflation data came in softer than anticipated, leading to a brief surge for the Australian Dollar earlier in the trading session. However, this downward momentum for the Greenback waned as it regained strength following stronger business activity figures. These readings underscored a continued resilience within the US economy. The US Dollar Index (DXY), a measure of the Greenback’s performance against a basket of six major currencies, was hovering near 99.00, reflecting modest weekly gains of approximately 0.4% so far.
Inflation Data and Federal Reserve Policy Outlook
Data released by the US Bureau of Labor Statistics (BLS) indicated that the Consumer Price Index (CPI) saw a monthly increase of 0.3% in September. This figure fell short of the 0.4% forecast and represented a slowdown from the 0.4% recorded in August. On an annual basis, headline inflation rose to 3.0%, which was below the projected 3.1% and only slightly higher than the 2.9% seen in August. The Core CPI, which excludes volatile food and energy prices, also showed softer-than-expected results, with a monthly increase of 0.2% and an annual rise of 3.0%.
💡 These inflation figures have reinforced market expectations that the Federal Reserve (Fed) will likely maintain its current monetary policy stance following its September rate cut. Traders are largely anticipating another 25-basis-point rate reduction at the upcoming monetary policy meeting scheduled for October 29-30.
US Business Activity Demonstrates Continued Strength
In contrast to the inflation data, the S&P Global Flash Composite PMI indicated a robust expansion in the private sector, rising to 54.8 in October from 53.9 in September. This marked the strongest pace of business activity expansion in three months. The Services PMI component surged to 55.2, while the Manufacturing PMI also saw a modest increase, reaching 52.2.
📊 However, not all economic indicators painted a uniformly positive picture. The University of Michigan’s (UoM) Consumer Sentiment Index revealed a weaker outlook for household confidence. The final reading for the Consumer Sentiment Index in October was revised downwards to 53.6 from an initial estimate of 55.0. Similarly, the Consumer Expectations Index slipped to 50.3 from 51.2.
📍 Inflation expectations presented a mixed scenario. The outlook for the 1-year inflation rate remained steady at 4.6%, but the expectations for the 5-year inflation rate increased to 3.9%, up from 3.7% in the previous reading. These mixed signals contribute to the cautious sentiment in the market.
Technical Analysis and Market Sentiment
From a technical perspective, the AUD/USD pair is currently trading within a narrow range between 0.6480 and 0.6520. This sideways movement follows a recent Head-and-Shoulders pattern breakdown on the daily chart. The pair is trading below its 21-day, 50-day, and 100-day moving averages, suggesting a slight bearish bias in the short term.
⚡ The Relative Strength Index (RSI), positioned near 45, indicates a neutral sentiment, implying that market momentum is currently balanced between buyers and sellers. This suggests that neither a strong bullish nor bearish trend is dominant at this moment.
📌 Immediate support for the AUD/USD is identified at the 0.6480 level. A decisive break below this point could potentially lead the pair lower, targeting the 0.6450 level, followed by the August 22 low near 0.6415.
📌 Conversely, resistance is observed around the 0.6535 mark. A sustained daily close above 0.6560 could signal a potential shift, neutralizing the current bearish setup and opening the possibility for upward movement towards the 0.6600 level in the near future.
Key Economic Indicator Highlight
RBA Trimmed Mean CPI (YoY)
The Consumer Price Index (CPI), released by the Australian Bureau of Statistics on a quarterly basis, measures the changes in the price of a fixed basket of goods and services acquired by household consumers. The YoY reading compares prices in the reference quarter to the same quarter a year earlier. The trimmed mean, which is a measure of underlying inflation, is calculated as the weighted average of the central 70% of the quarterly price change distribution of all CPI components in order to smooth the data from the more-volatile components. Generally, a high reading is seen as bullish for the Australian Dollar (AUD), while a low reading is seen as bearish.
Expert Summary
The AUD/USD currency pair has remained largely flat, reflecting a market grappling with conflicting economic signals from the United States. While softer inflation data suggests a pause in Federal Reserve tightening, stronger business sentiment indicates underlying economic resilience. Technical analysis points to a period of consolidation with a slight downward bias, awaiting clearer directional impetus.