

Key Takeaways
- Bitcoin’s recent price decline signals potential profit-taking following its annual high.
- Technical analysis on the weekly chart reveals a rising wedge pattern and bearish divergence.
- These indicators, alongside potential mean reversion, suggest Bitcoin could drop below $60,000 in the near future.
Bitcoin Price Analysis: Technical Indicators Suggest Potential Downturn
Bitcoin (BTC) has recently experienced a price pullback, moving lower from its year-to-date high and erasing billions in market value. A thorough review of the weekly chart indicates the emergence of several bearish patterns that could push the price below the $60,000 level.
The BTC price has entered a correction phase after a sustained period of growth, shedding over 10% from its highest point this year.
Emerging Bearish Patterns and Price Targets
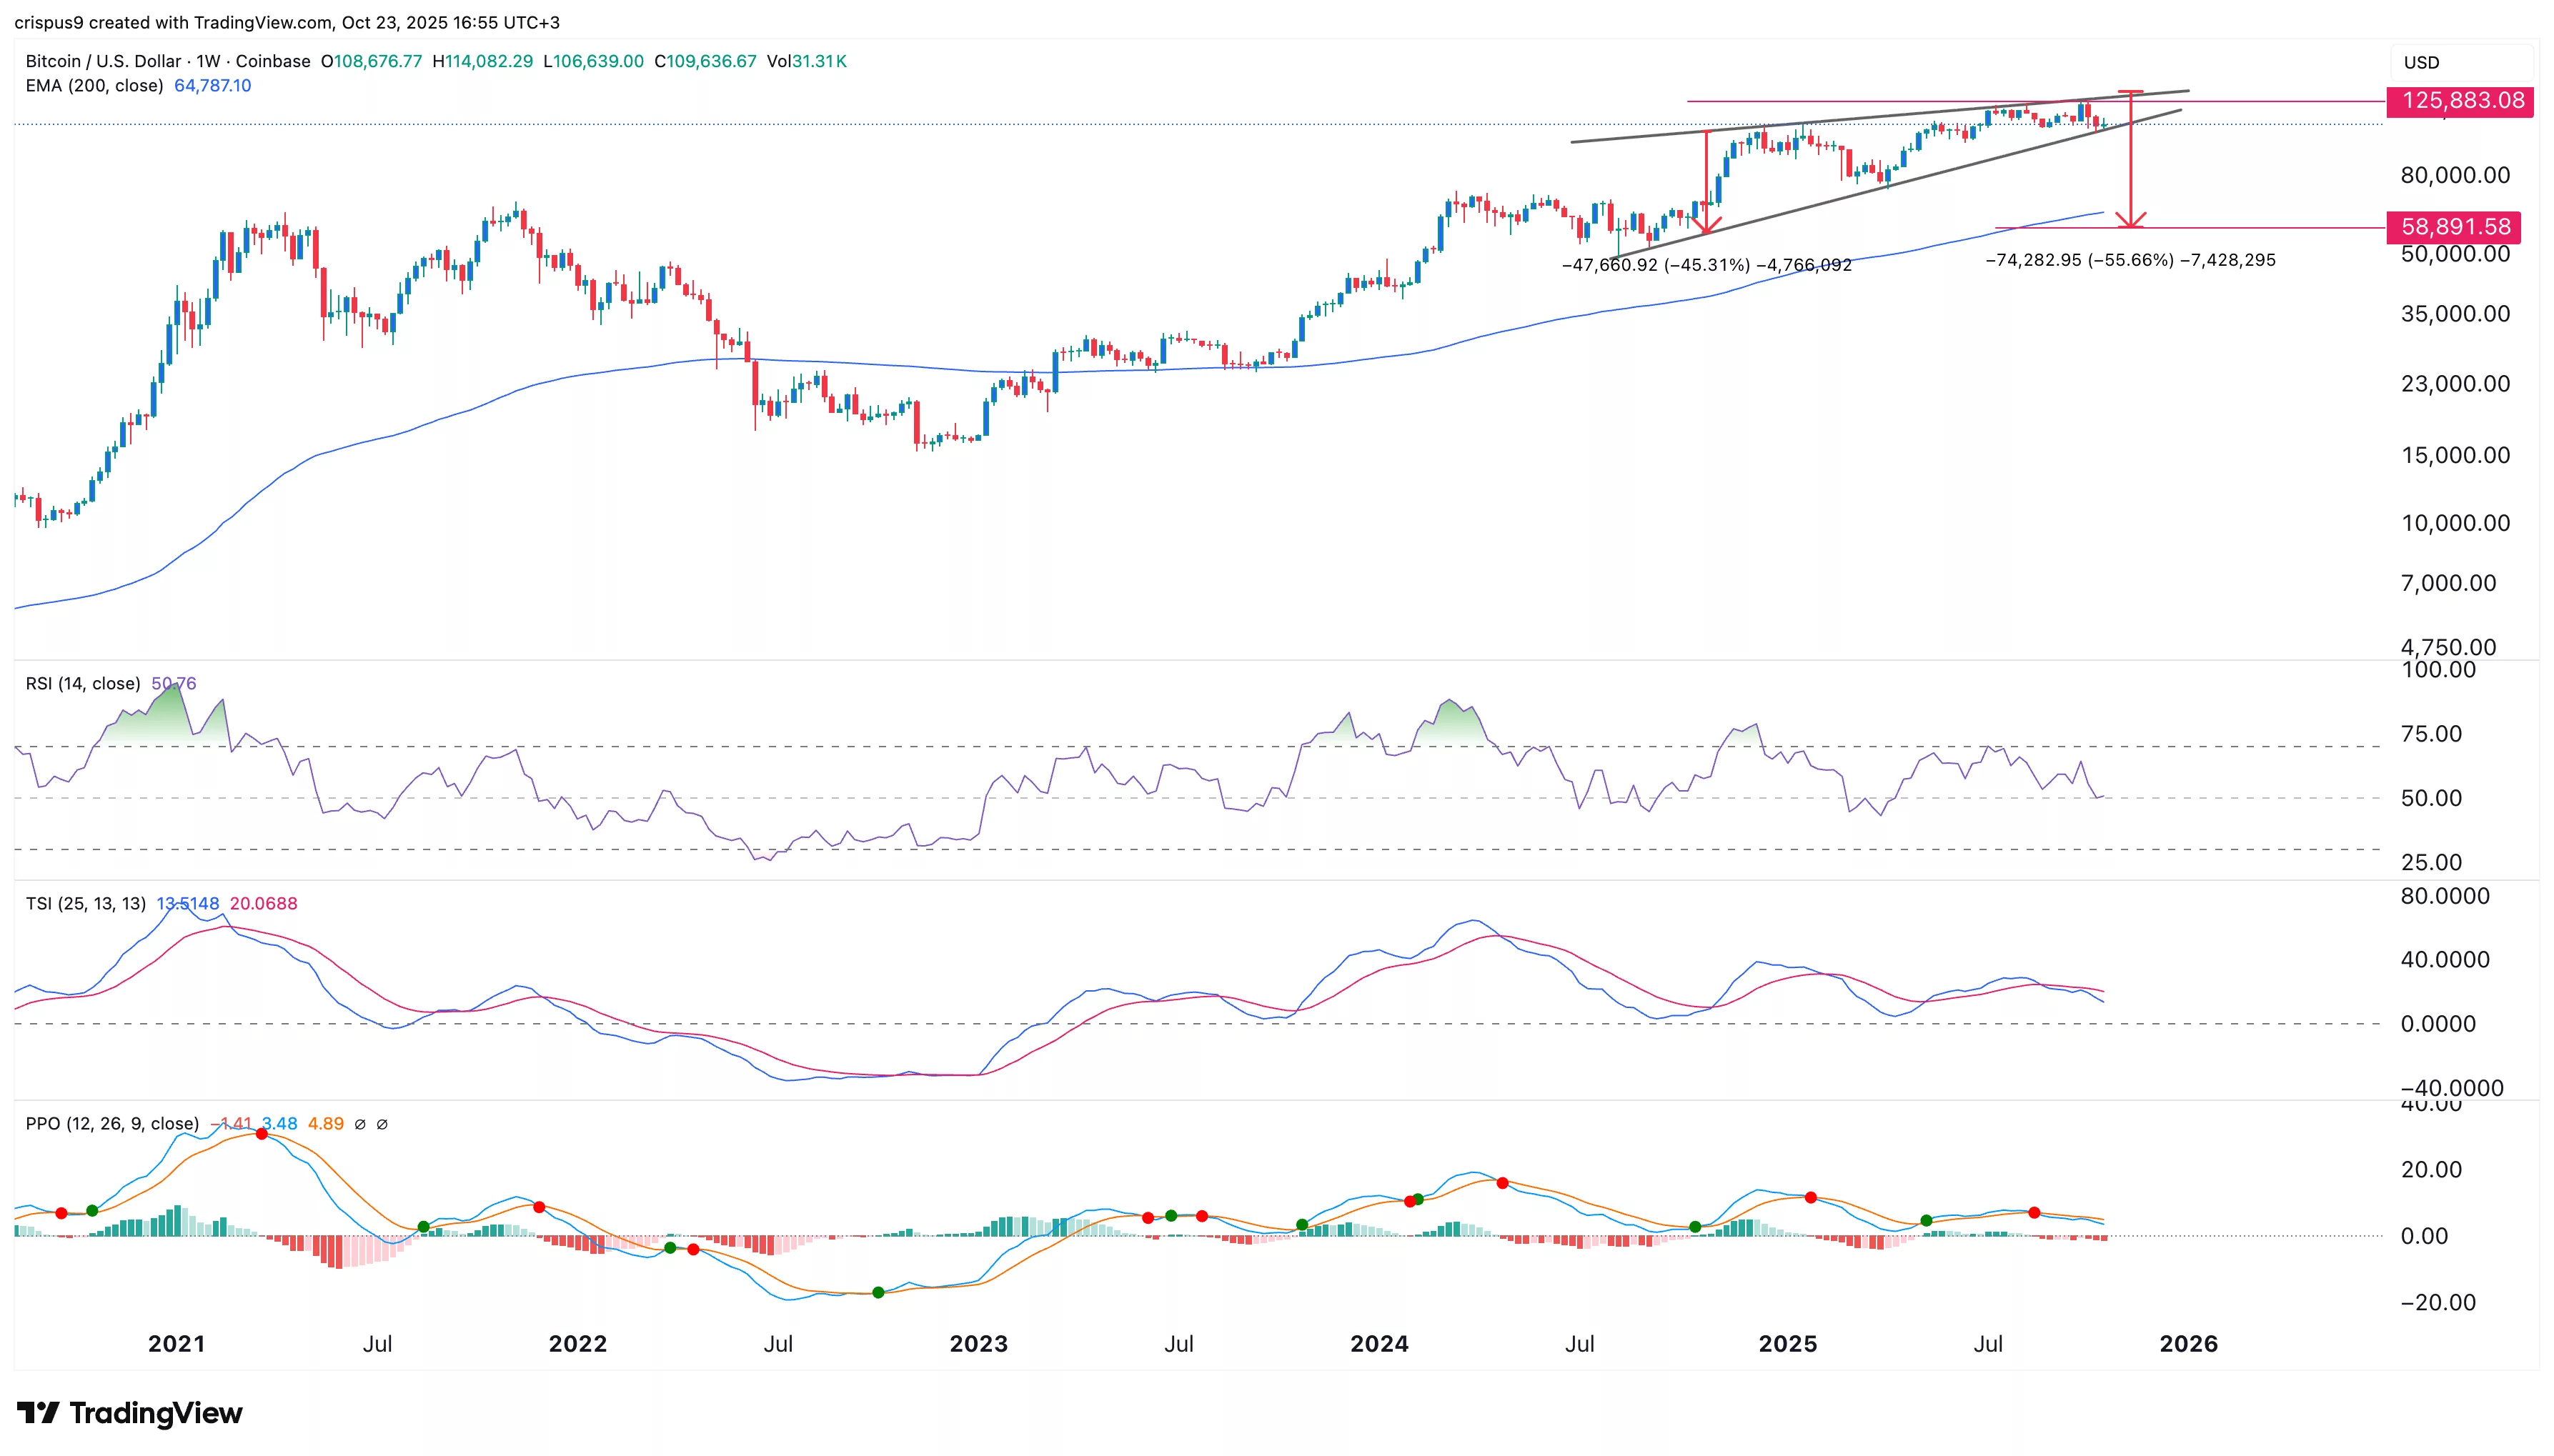
A closer examination of the weekly chart highlights the formation of a significant bearish rising wedge pattern. This pattern began to develop in December, following Bitcoin’s breakthrough of the crucial $105,000 resistance level.
The lower boundary of this wedge is defined by the lowest price points observed since September of the previous year. A typical bearish outcome for a rising wedge occurs as the converging trendlines approach their intersection point, a scenario that is currently unfolding.
The projected price target for a wedge pattern is often calculated by taking the pattern’s widest point and subtracting it from the estimated breakout point. In this specific configuration, the widest section measures roughly 45%. Applying this measurement from the potential breakout zone suggests a price target of approximately $58,890.
Additional Bearish Signals for Bitcoin
Beyond the rising wedge, other factors are contributing to a more cautious outlook for Bitcoin’s price. The current price remains notably above the 200-week moving average, which is positioned at $64,786. This substantial discrepancy hints at a potential for mean reversion, where an asset’s price tends to gravitate back towards its historical average.
💡 Furthermore, Bitcoin has exhibited bearish divergence across several key technical indicators. The Relative Strength Index (RSI), True Strength Index (TSI), and Percentage Price Oscillator (PPO) have all shown downward trends while the price has been ascending. Such divergences often signal weakening momentum and can precede a price reversal.
⚡ This combination of factors—the potential for mean reversion, the developing rising wedge pattern, and the observed bearish divergence—collectively suggests a possible price breakdown. A sustained move above the year-to-date high of $126,200 would be required to invalidate this bearish forecast.
Historical Context of Bitcoin Drawdowns
A hypothetical drop in Bitcoin’s price to $58,000 would represent a 55% decrease from its all-time high. While this decline might appear substantial, historical data demonstrates that Bitcoin has experienced similar, and even more significant, drawdowns in the past.
📍 For instance, during 2022, Bitcoin underwent a severe crash, falling 77% from its peak to a low of $15,392. This period was characterized by major collapses within the crypto market, including those of FTX and Terra, alongside aggressive interest rate hikes by the Federal Reserve.
✅ More recently, Bitcoin experienced a 34% correction between its December high and its April low. Similarly, in 2021, the price saw a 55% fall from its April highs to the June lows of that year.
📊 Notably, each of these substantial drawdowns has historically presented favorable entry points for investors, as Bitcoin has consistently demonstrated its capacity to recover and set new all-time highs.
Expert Summary
Current technical analysis for Bitcoin indicates a potential price correction, possibly dipping below $60,000, driven by a rising wedge pattern, bearish divergence, and the likelihood of mean reversion. Despite these indicators pointing to short-term weakness, historical precedents show that Bitcoin has navigated similar drawdowns, often paving the way for future growth opportunities.