Bonk Price Shows Weakening Momentum Amidst Low Trading Volume
Key Takeaways
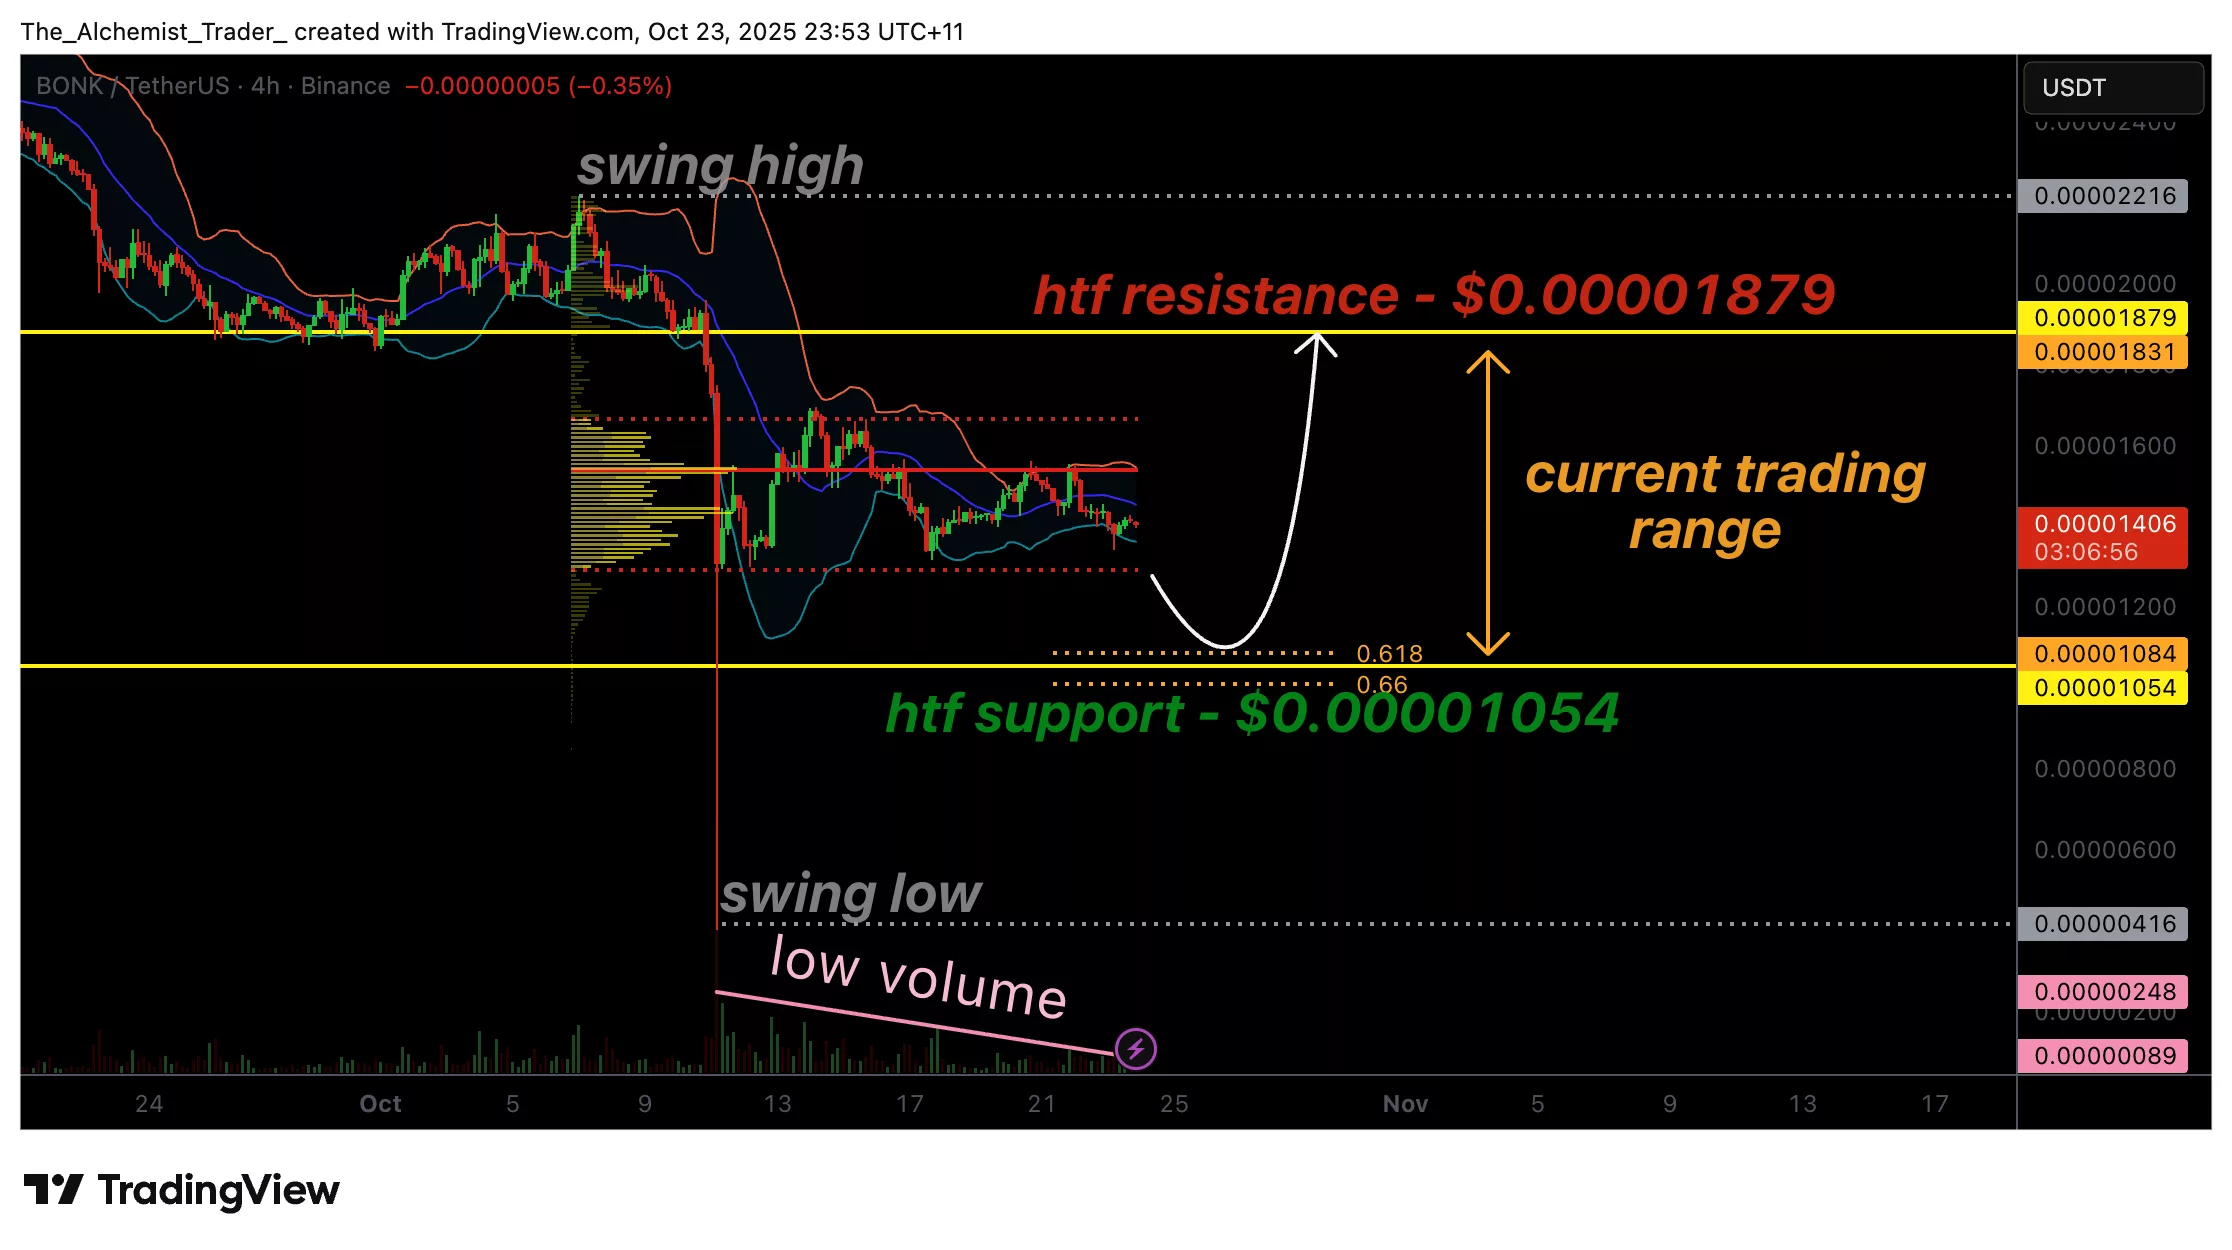
- Bonk is currently trading within a defined range, influenced by support at $0.00001054 and resistance at $0.0000187.
- A consistent decline in trading volume suggests diminishing demand for the asset.
- The price may revisit the $0.00001054 support level before any potential upward movement.
Bonk’s (BONK) recent price performance indicates a noticeable loss of momentum. This waning trend is underscored by declining trading volumes and a lack of sustained buying pressure, suggesting weakening market demand. Despite attempts to rally, Bonk has struggled to establish a firm upward trajectory, remaining confined within its established trading range between key support and resistance levels. The continued decrease in trading volume raises the possibility of a downward price adjustment, potentially retesting lower support around the $0.00001054 mark.
Bonk Price Technical Analysis
The current trading environment for Bonk is characterized by several key technical indicators suggesting potential volatility. The price action displays a lack of conviction, with minimal trading volume accompanying recent upward movements. This suggests that demand remains subdued, and the market is not yet ready for a substantial recovery. The price is navigating a range, with significant resistance overhead and a critical support level below.
Low-Volume Trading Indicates Weak Demand
💡 The current upward price action is not supported by substantial trading volumes. This lack of strong buying interest indicates that the demand for Bonk is weakening. Without a significant increase in volume, any bounce is likely to be short-lived, and further downside pressure may emerge.

Key Support and Resistance Markers
📍 Bonk is currently positioned mid-range, facing resistance near $0.00001879 and finding support around the $0.00001054 level. This latter level is particularly significant, coinciding with the 0.618 Fibonacci retracement from a high-timeframe perspective. This confluence of technical factors makes $0.00001054 a crucial zone for potential price stabilization.
The price action indicates that Bonk is consolidating without clear direction. The established range between $0.00001054 and $0.00001879 represents the current trading boundaries. Multiple attempts to break out or bounce significantly have failed to gain traction, largely due to insufficient trading volume. This suggests a market dominated by passive trading rather than aggressive buying, limiting the potential for a sustained recovery.
Bonk’s Current Market Structure and Outlook
⚡ The overall market structure for Bonk can be described as neutral to bearish in the short term. The low trading volume and the absence of strong bullish sentiment are exerting downward pressure. The token is in a state of consolidation, lacking the significant volume expansion needed to signal a shift in trend towards bullish territory.
📊 If Bonk’s price revisits the $0.00001054 support level and shows signs of consistent demand, it could validate this level as the lower boundary of the current range. Such a scenario might initiate a new accumulation phase, setting the stage for a potential upward movement. Conversely, a failure to hold this support, coupled with continued low volume, could lead to an extended correction, with the price exploring lower, untested price levels before finding a stable base.
What to Expect in the Coming Price Action
📌 As long as trading volume remains at low levels, Bonk’s price is likely to drift downwards, testing the $0.00001054 support. A robust bounce from this level, accompanied by increasing demand, could signal renewed buying interest and potentially drive the price back towards the $0.00001879 resistance zone.
Expert Summary
Bonk’s price is showing signs of weakening momentum, primarily due to low trading volume indicating a lack of strong buyer demand. The asset is trading within a well-defined range, with a potential retest of the $0.00001054 support level on the horizon before any significant recovery can be expected.

