

Key Takeaways
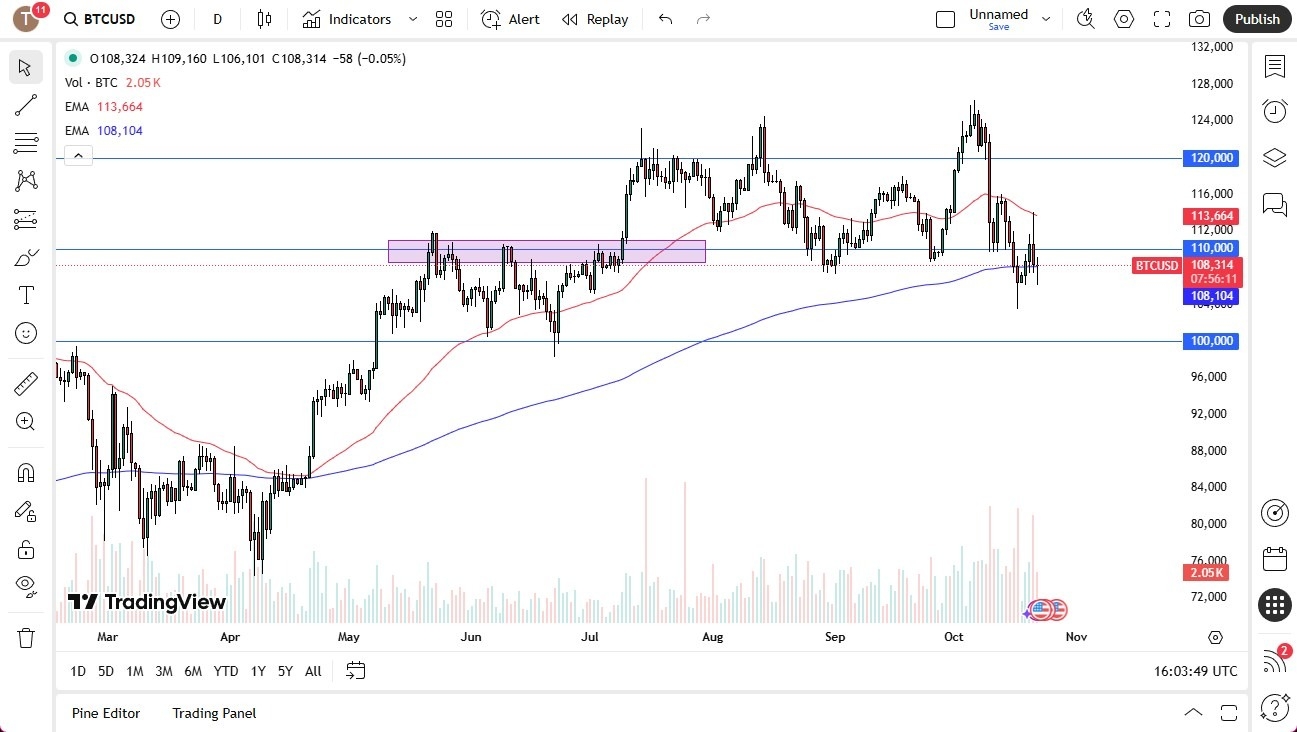
- Bitcoin demonstrated resilience, recovering near the 200-day Exponential Moving Average (EMA) and forming a hammer candlestick pattern after earlier declines.
- Analysts are closely watching the $110,000 level as significant resistance and $100,000 as critical support.
- Short-term price action is expected to remain volatile with the possibility of sideways consolidation.
- Despite market noise, Bitcoin’s ability to stabilize around $105,000 indicates some underlying strength.
Bitcoin’s Recent Price Action Analysis
Bitcoin experienced a notable downturn during Wednesday’s trading session but has since shown signs of stabilization and recovery. The cryptocurrency managed to rebound, finding support near its 200-day Exponential Moving Average (EMA) and forming a pattern that resembles a hammer candlestick.
This recovery is particularly significant given the preceding candlestick, which was a shooting star pattern. The current movement suggests that Bitcoin is holding firm around this key technical level.
Key Price Levels to Watch
Analysts are maintaining their focus on specific price points that could dictate Bitcoin’s short-to-medium term trajectory. The $110,000 mark is identified as a crucial resistance level. Conversely, $100,000 is considered a significant support zone, a level that is psychologically important due to its round number status.
The market is anticipating continued volatility, a characteristic often associated with Bitcoin, especially during periods of broader market uncertainty.
If Bitcoin fails to hold its current gains and breaks below the recent hammer formation around the $104,000 mark, attention will likely shift to the $100,000 support level.
Outlook on Bitcoin Volatility
The inherent volatility of Bitcoin is not unexpected and is often amplified by broader market conditions. Recent movements in traditional safe-haven assets like gold and silver suggest a general period of uncertainty in financial markets, which can spill over into cryptocurrency trading.
⚡ While the overall market sentiment might be cautious, Bitcoin’s ability to resist a steeper decline, as evidenced by its stabilization around the $105,000 area, is a positive signal for its supporters. This resilience is particularly noteworthy when compared to the performance of other assets.
This suggests that sideways consolidation may be a likely scenario in the near future. However, a decisive break below the $100,000 level could signal a more significant downward trend, though this is not anticipated in the immediate short term by many analysts.
Trading Bitcoin often requires a robust strategy, especially given its dynamic nature. For those looking to engage in Bitcoin trading, exploring a reliable forex forecast can provide valuable insights.
Expert Insights
The current market action for Bitcoin indicates a phase of testing key support levels after recent declines. The formation of a hammer candlestick near the 200-day EMA suggests potential buying interest emerging at these lower prices.
While volatility is expected to persist, the ability to hold above critical support at $100,000 will be crucial in determining the near-term trend. Sideways movement is a strong possibility as the market digests recent price action and wider economic factors.