
Quick Analysis: Cardano’s Potential for a Third Major Rally
- Cardano (ADA) has experienced significant past rallies, offering 50-100x returns, and the potential for a third is present.
- Current market analysis suggests ADA is potentially at a bottom, with key resistance levels to overcome for a new all-time high (ATH).
- The ADA/BTC pair shows signs of bottoming out, indicating potential for upward movement, especially during altcoin seasons.
- Key short-term indicators for ADA include holding the $1 mark and regaining moving averages on the 4-hour chart.
Although Cardano’s price has faced challenges staying above the $1 mark recently, its history is punctuated by impressive runs in 2018 and 2021, which yielded substantial returns of 50-100x for investors. The crucial question remains: could a third major price surge be on the horizon, and what form might it take? We’ll delve into the technical analysis to assess this possibility.
💡 Monitor historical price action for patterns that might precede significant rallies in ADA.
Cardano Analyst Projects ADA Rally to $5-$8 Despite Market Weakness pic.twitter.com/kb4zn5sO1H
— Cardano Feed ($ADA) (@CardanoFeed) October 15, 2025
Considering a potential price target of $5-$8, this would imply a fully diluted valuation (FDV) of around $300 billion. Given Cardano’s position as a leading Layer 1 cryptocurrency, attracting a significant portion of the market capitalization seems plausible, especially if broader market conditions improve or specific sector approvals occur. Let’s examine the technical charts for further insights.
💡 Always consider the market capitalization implications of ambitious price targets.
Is Cardano Price Stabilizing? The Path to a New All-Time High
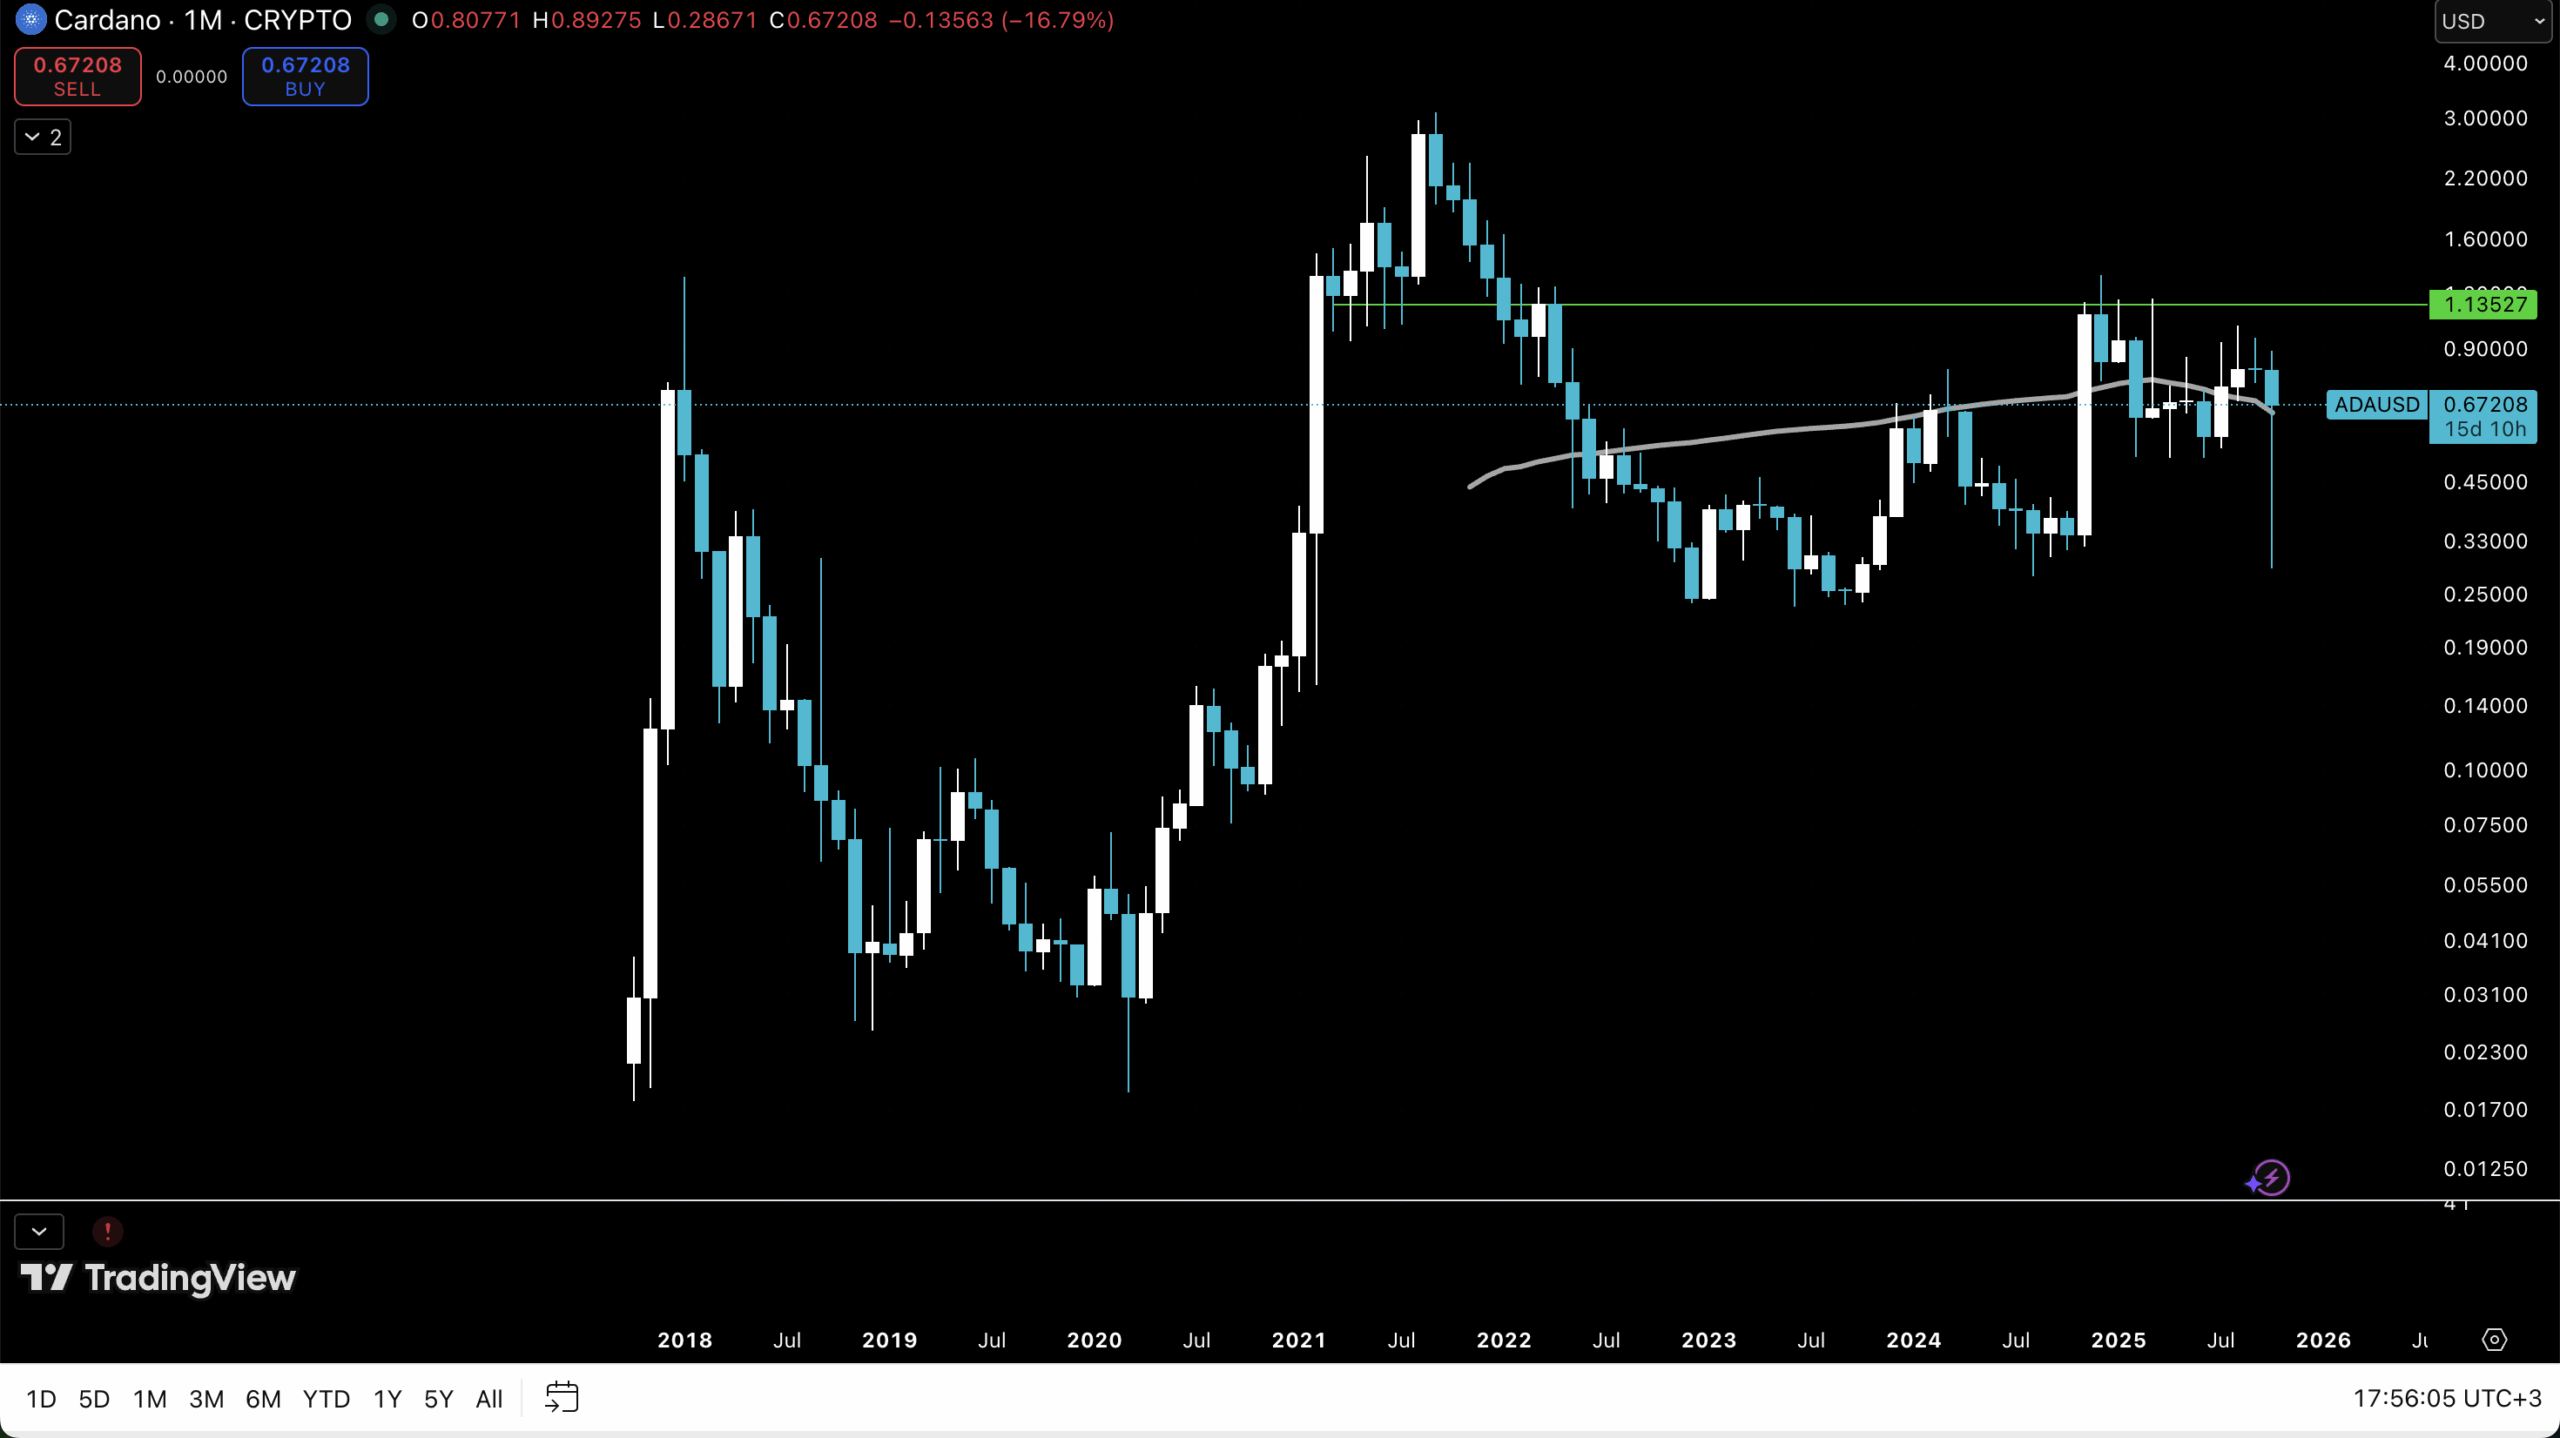
The monthly chart presents an optimistic outlook, with the latest candle maintaining its position above the 50-period moving average (MA50). While the month isn’t closed, this consolidation is a positive sign. A critical resistance level to watch is $1.13, which previously acted as support and is now serving as a hurdle. A decisive break above this level could open the path toward the previous all-time high of $3.
💡 Keep a close watch on the monthly candle close for confirmation of support.
📍 Focus on the $1.13 level as a key indicator for potential upward momentum.
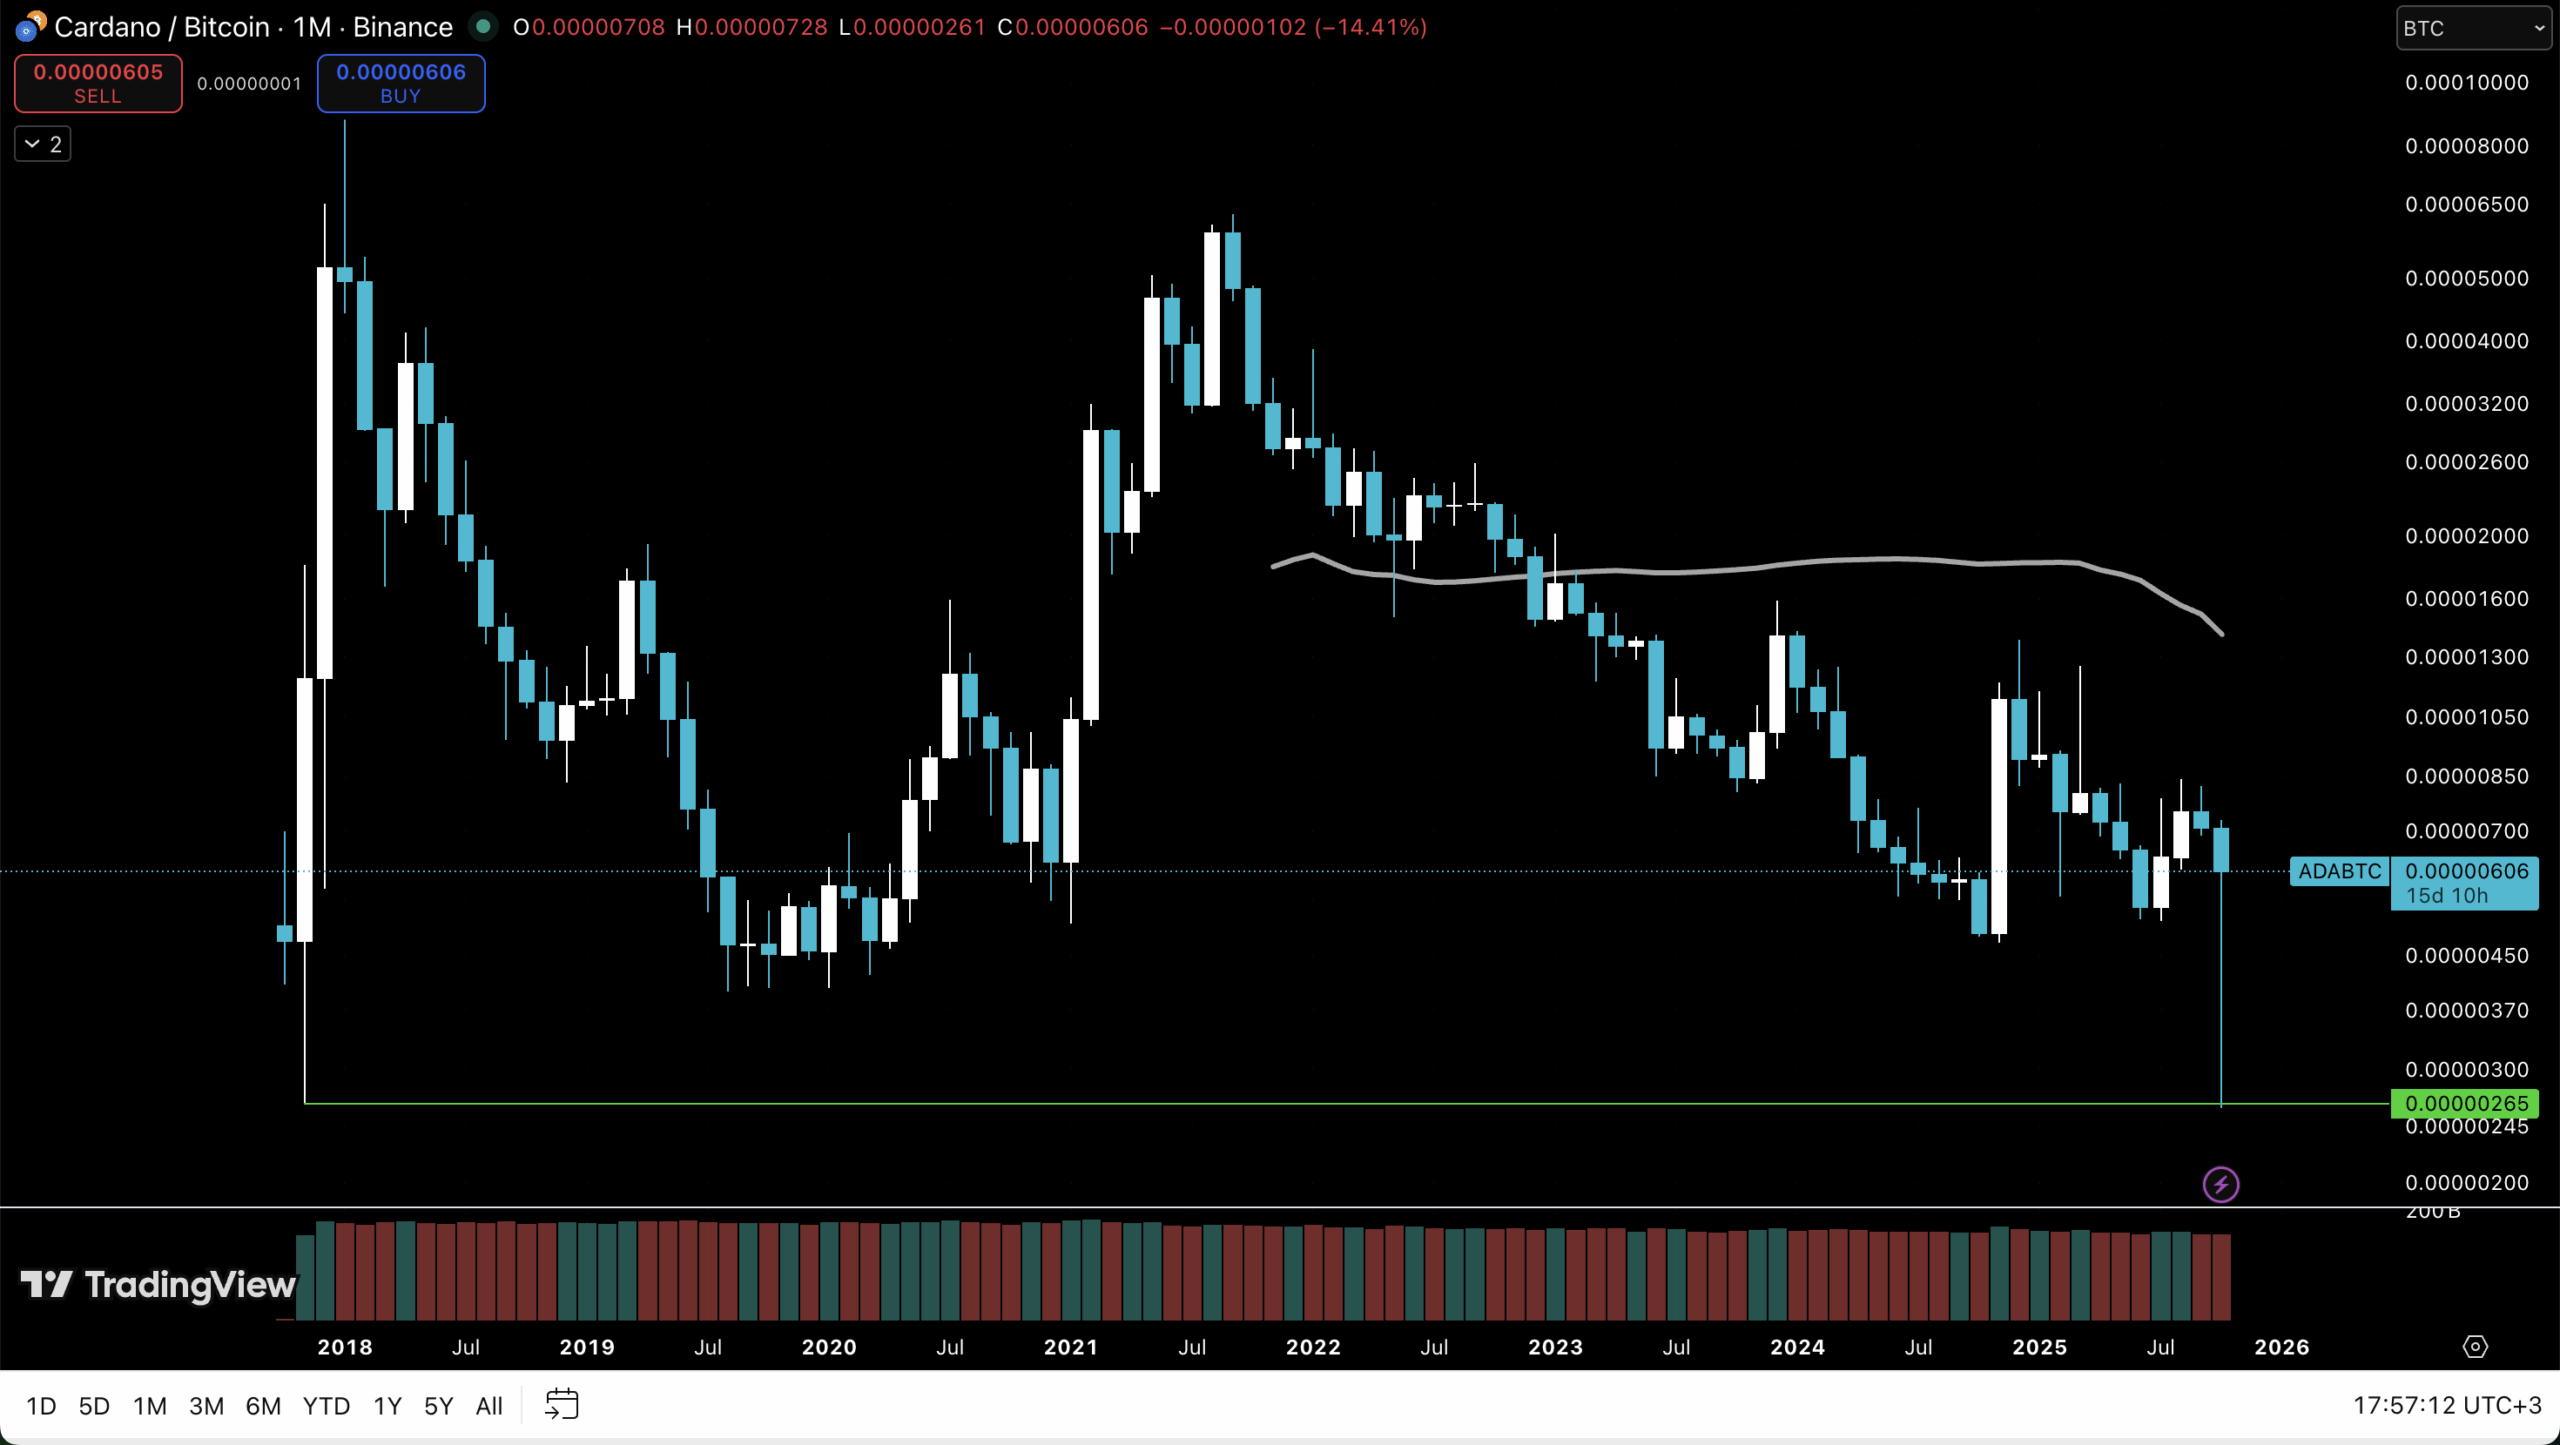
When considering altcoin market potential, the ADA against Bitcoin (BTC) chart is particularly insightful, echoing the significant moves seen in 2018 and 2021. A similar pattern could emerge soon, benefiting ADA holders. Currently trading near the bottom of its established range, ADA appears poised to potentially retest the upper boundaries of this range within the coming months.
⚡ Analyze altcoin pairs against Bitcoin to gauge broader market sentiment and potential performance.
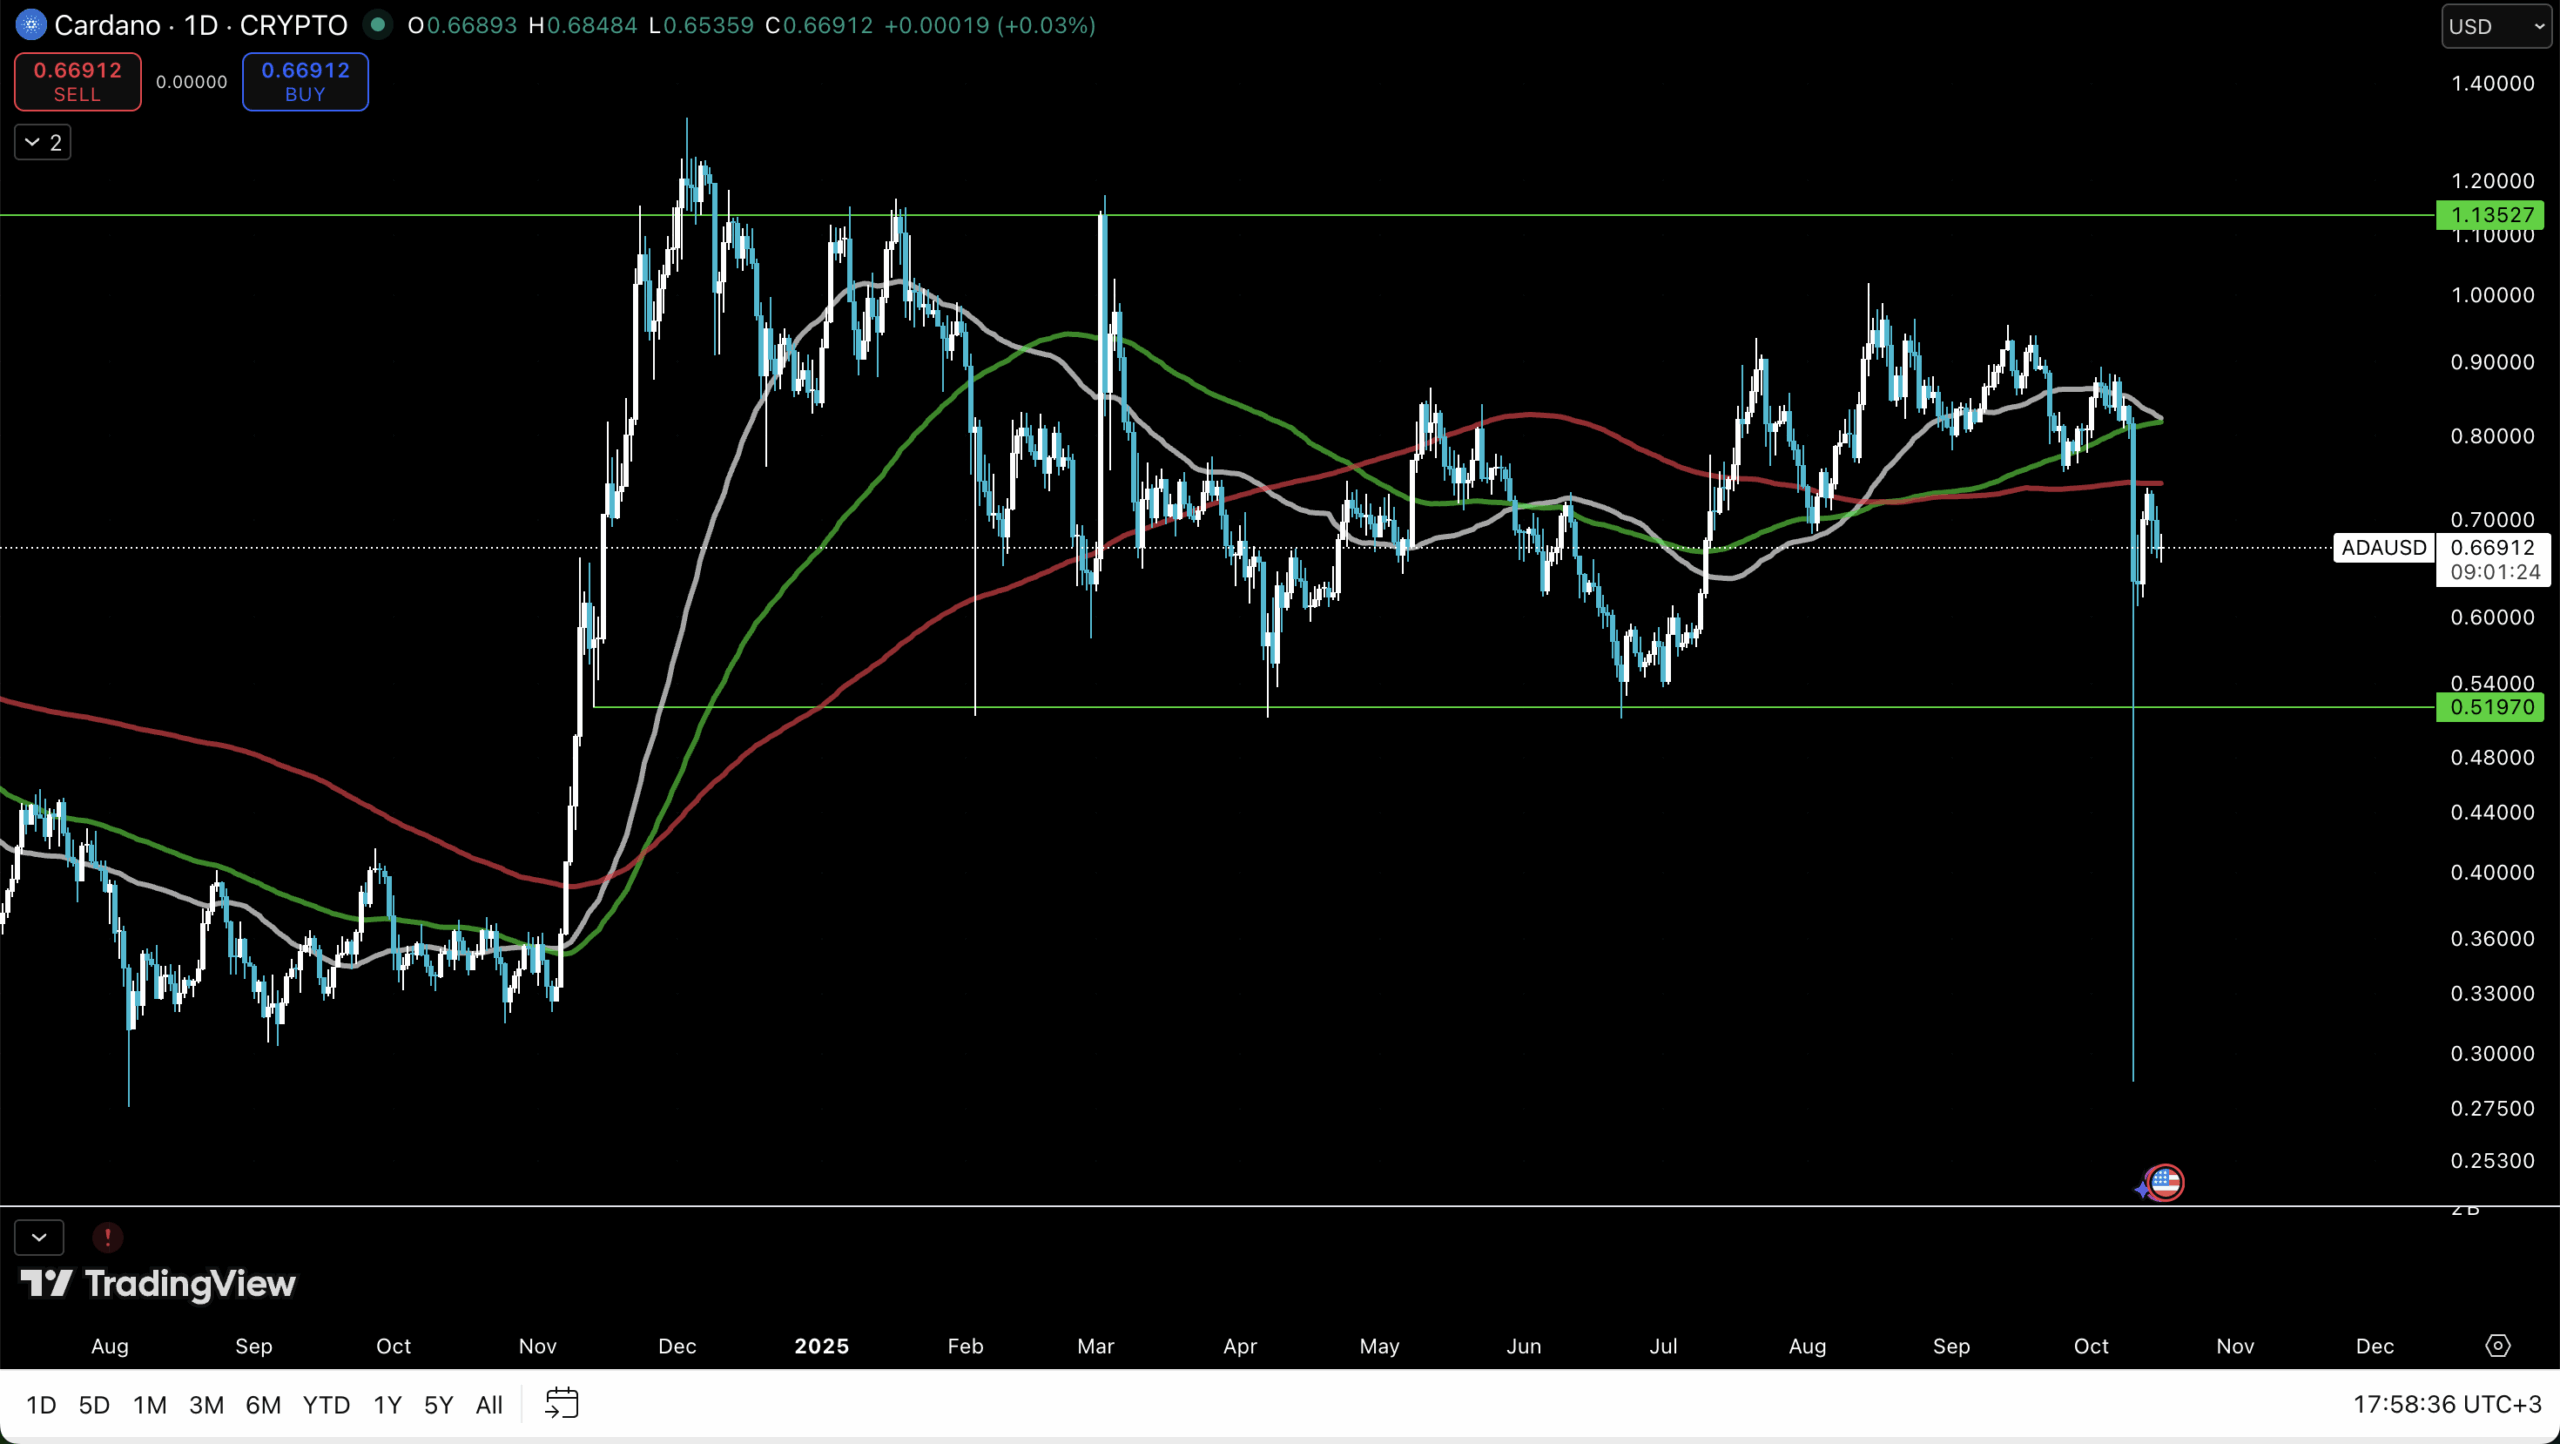
Examining the daily chart reveals a prolonged period of range-bound trading, lasting nearly a year, with a notable long wick from a recent liquidation cascade. At present, Cardano’s price is trading below all its key moving averages. A crucial prerequisite for any significant upward movement appears to be reclaiming these averages. Until that happens, there remains a possibility of retesting the $0.52 support level.
🔴 A sustained recovery above key moving averages on the daily chart is essential for bullish sentiment.
What’s Next for ADA?
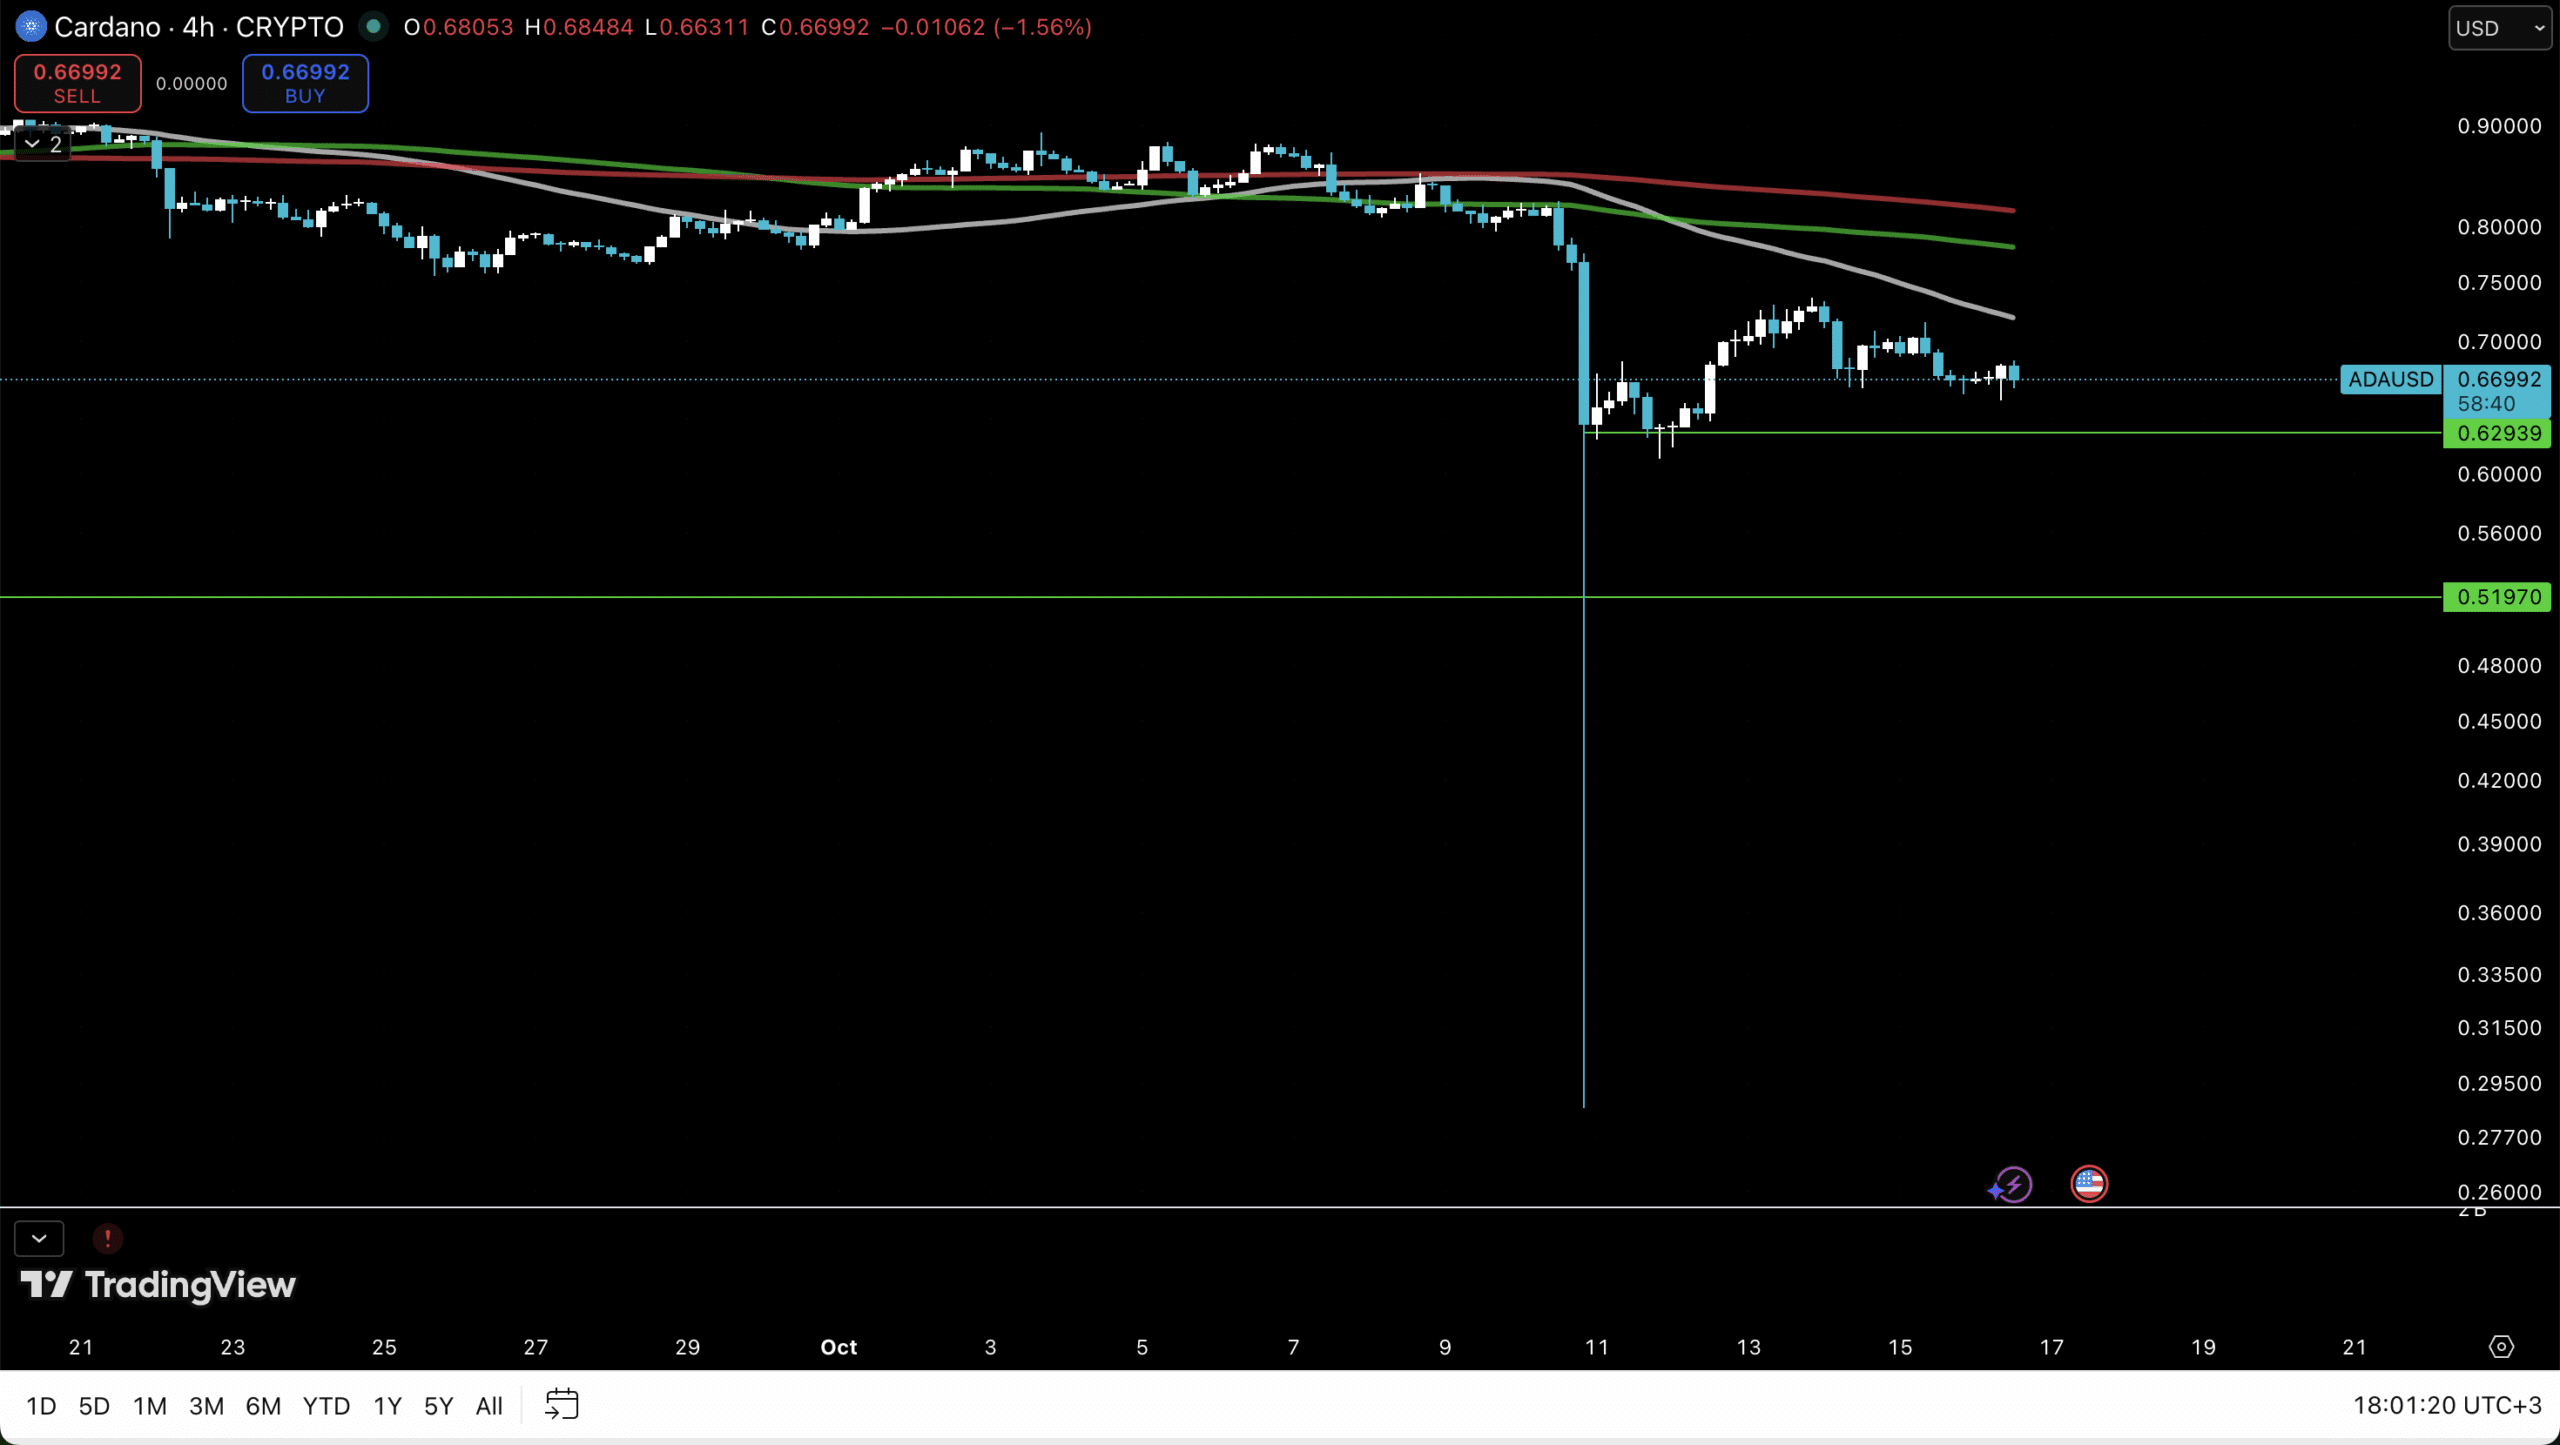
The 4-hour timeframe shows a significant downward wick contrasted against a period of tight consolidation. The price drop followed Cardano’s inability to hold moving averages. Currently, a support level appears to be forming around $0.63. The critical question is whether this support will hold, allowing ADA to recapture its moving averages and challenge higher price levels, or if it will lead to another test of the $0.52 mark. The market is in a waiting phase.
📊 Observe the $0.63 support level closely for signs of trend reversal on the 4-hour chart.
Fundfa Insight
Cardano’s technical indicators suggest it is potentially at a turning point. While facing current resistance and trading below key averages, historical performance indicates a capacity for significant upside. The ADA/BTC pair shows promise, and a sustained recovery above daily moving averages could signal the start of a new uptrend, possibly retesting previous highs.