

Key Takeaways
- Nvidia experienced a slight downturn on Wednesday, dropping over 1.2%, but the broader technical outlook remains bullish.
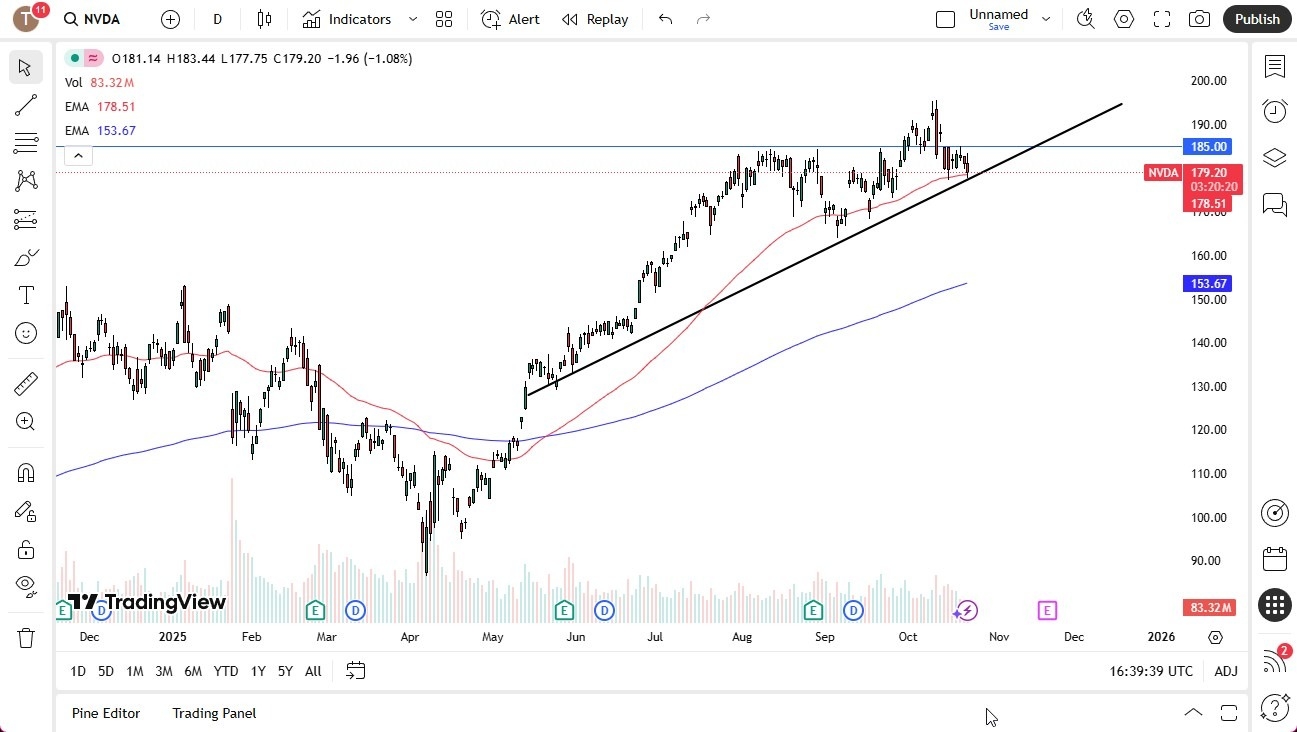
- The stock is currently consolidating near the 50-day Exponential Moving Average (EMA), a key support level for traders.
- A decisive break above the $185 resistance could signal a strong upward movement, potentially targeting the $200 mark.
- Conversely, a close below the $170 level might invite further selling pressure.
Market Analysis and Technical Outlook
Wednesday saw a modest decline for Nvidia, with the stock dropping slightly over 1.2% during the afternoon trading session. Despite this short-term negative pressure, often attributed to geopolitical tensions such as tariff threats impacting global markets, the overall technical picture for Nvidia remains positive.
⚡ The market appears to be in the process of finding a stable floor, suggesting that the recent downward move might be a temporary correction within a larger bullish trend.
Nvidia’s Technical Landscape
From a longer-term perspective, the technical analysis for Nvidia remains bullish. The stock has been closely trading around the 50-day Exponential Moving Average (EMA), a widely watched indicator for potential support. Over the past week, this moving average has indeed acted as a support zone.
📍 Additionally, an uptrend line situated just below the 50-day EMA provides further support, making this area an attractive point for value-oriented buyers.
The market has seen significant investor inflows recently, indicating strong underlying demand. However, a notable resistance barrier exists at the $185 level, which will be a critical point to monitor.
Potential Trading Scenarios
If Nvidia demonstrates the ability to break decisively above the $185 resistance level, this would likely trigger a surge in buying activity, propelling the stock higher. In such a scenario, traders might target the next significant psychological resistance at the $200 level.
💡 Conversely, a breakdown below the $170 mark, a large and psychologically important round number where previous price action has occurred, could signal increased downside risk and attract further selling.
For traders looking to enter the market, a potential strategy involves being a buyer if Nvidia can sustain a break above $185, with a stop-loss order placed at $180. The target for such a trade would be the $198 level.
📊 The market’s ability to hold above the 50-day EMA and the established uptrend line is crucial for maintaining the bullish sentiment. Any sustained move above $185 would confirm the bullish outlook and suggest potential for further upside.
Expert Summary
The technical outlook for Nvidia remains bullish despite recent minor pullbacks. Key support is observed around the 50-day EMA and an uptrend line, while resistance is noted at $185.
A break above $185 could lead to a significant rally towards $200, offering a potential buying opportunity for traders.