

Quick Summary
- Gold (XAU/USD) is experiencing a rebound, influenced by softer US Consumer Price Index (CPI) data and easing US-China trade tensions.
- US President Trump is set to meet with Chinese counterpart Xi Jinping, offering hope for de-escalation in trade disputes.
- Fundamental factors like the US government shutdown and economic uncertainties continue to support safe-haven demand for gold.
- The Federal Reserve is widely expected to cut interest rates, which typically benefits non-yielding assets like gold.
- Technical analysis suggests a bearish short-term outlook for XAU/USD, with key resistance at $4,150 and support at $4,000.
Gold Rebounds Amidst Shifting Market Dynamics
Gold (XAU/USD) is staging a recovery on Friday, paring its intraday losses as the US Dollar and Treasury yields softened following the release of US Consumer Price Index (CPI) data that came in below expectations.
At the time of reporting, XAU/USD is trading around the $4,100 mark. This marks a recovery from earlier session lows near $4,044, though the precious metal remains on track to end a nine-week streak of gains.
💡 Market sentiment saw a modest improvement on the prospect of de-escalation in the renewed US-China trade standoff. The White House confirmed that US President Donald Trump is scheduled to meet with Chinese President Xi Jinping on October 30, on the sidelines of the APEC Summit in South Korea. This development has contributed to easing recent trade tensions.
Supportive Fundamentals for Gold
The fundamental landscape for gold continues to be supportive. Persistent geopolitical and economic uncertainties, coupled with the prolonged United States government shutdown, are driving safe-haven demand for the yellow metal.
Furthermore, market participants widely anticipate that the Federal Reserve will implement a 25-basis-point interest rate cut at its upcoming monetary policy meeting on October 29-30. Lower borrowing costs generally enhance the attractiveness of non-yielding assets like gold, as they reduce the opportunity cost of holding such assets.
Market Movers: US CPI and Trade Talks Take Center Stage
The latest figures from the US Bureau of Labor Statistics revealed that the Consumer Price Index (CPI) increased by 0.3% month-over-month in September. This figure fell short of the 0.4% forecast and represented a slowdown from August’s 0.4% rise. On an annual basis, headline inflation rose by 3.0%, below the projected 3.1% and a slight increase from the 2.9% recorded in August.
💡 The Core CPI, which excludes volatile food and energy prices, also rose by 0.2% month-over-month, missing the 0.3% forecast and matching the 0.3% gain seen in August. Annually, core inflation was up 3.0%, also below the 3.1% forecast and the previous month’s reading.
Following the CPI data, traders are now shifting their focus to upcoming economic indicators, including the S&P Global preliminary PMI data for October and the final University of Michigan sentiment survey, both scheduled for release later on Friday.
📍 US-China trade headlines remain a dominant factor in the markets, particularly after escalating earlier in the month. China’s decision to expand export restrictions on rare earth materials prompted President Donald Trump to threaten 100% tariffs on Chinese imports, leading to retaliatory measures from both sides.
⚡ High-level economic and trade discussions are underway in Malaysia, where US Treasury Secretary Scott Bessent and US Trade Representative Jamieson Greer are meeting with Chinese Vice Premier He Lifeng. These talks aim to ease recent tensions between the two economic powers.
📊 US-Canada trade relations have also experienced a downturn. President Donald Trump announced on Thursday that the US is ceasing all trade negotiations with Canada, citing a controversial advertisement aired by the Ontario provincial government.
Technical Analysis: XAU/USD Consolidates Below Key Resistance
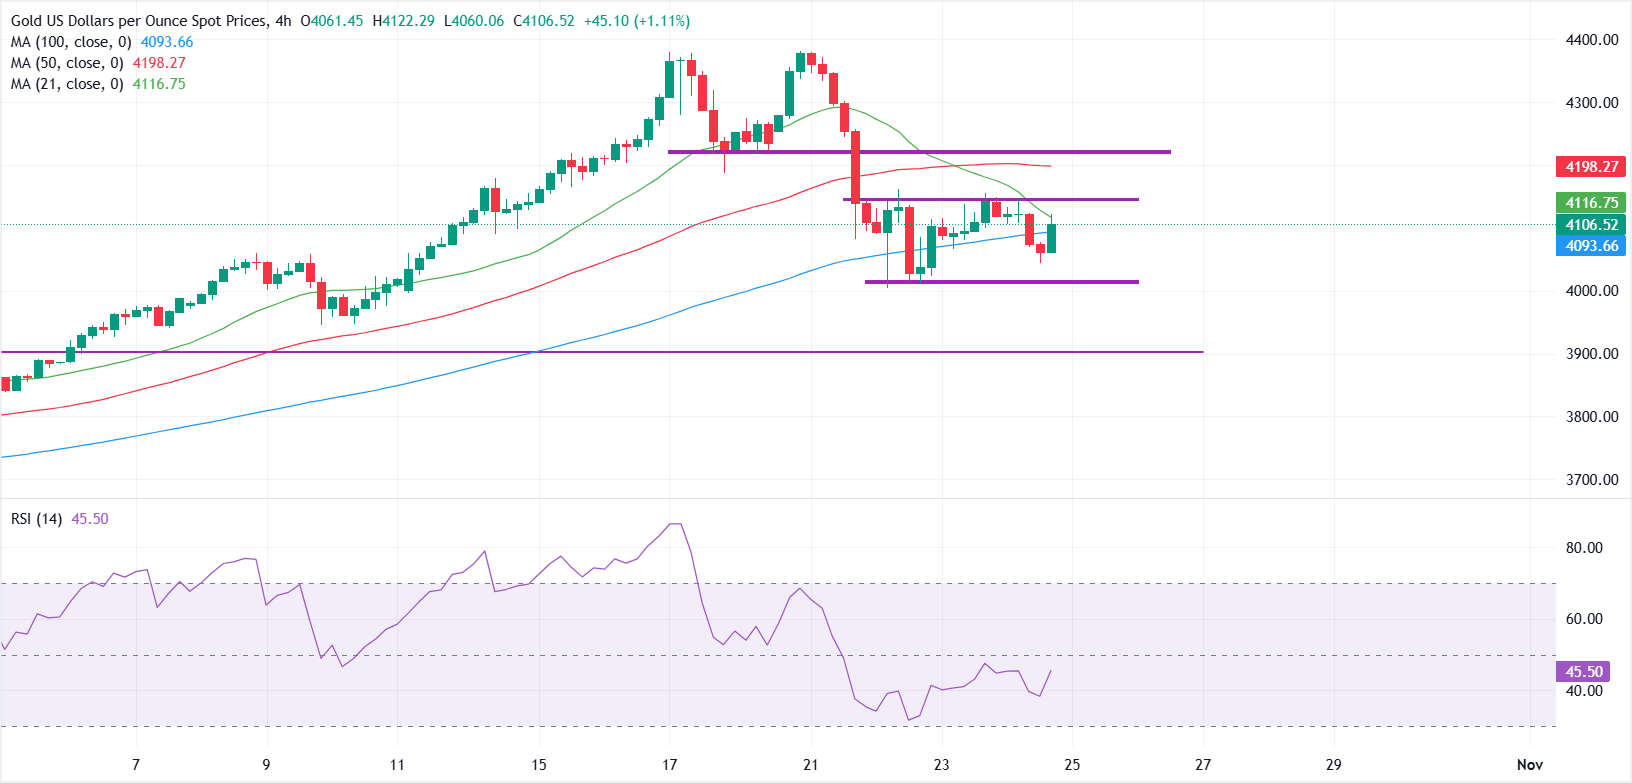
XAU/USD is exhibiting early signs of consolidation following a robust rally. The short-term outlook has turned bearish, as the metal is now trading below the 21, 50, and 100-period Simple Moving Averages (SMAs) on the 4-hour chart, indicating a weakening of bullish momentum.
📍 On the downside, the psychological level of $4,000 represents a critical support zone. Buyers have shown activity in this area in recent trading sessions. A decisive breach below this level could potentially lead to a deeper pullback towards the $3,900 region.
⚡ Immediate resistance is observed at the 100-SMA, located near $4,090, followed by the $4,150 level. A sustained move above this resistance zone would pave the way for a potential advance towards the $4,200 level. However, stronger selling pressure is anticipated around $4,200 unless bulls can achieve a decisive breakout.