

Key Takeaways
- HYPE price has seen a 19% increase over the last seven days.
- Significant developments include HYPE’s listing on Robinhood and plans by Hyperliquid Strategies Inc. to raise funds for token accumulation.
- Technical analysis indicates that HYPE is nearing a bullish breakout from a falling wedge pattern on its 4-hour chart.
- Institutional interest is growing, with ENDRA Life Sciences acquiring $3 million in HYPE tokens.
The price of Hyperliquid (HYPE) is showing signs of a potential bullish breakout, driven by recent developments and a favorable technical setup. As of market close on October 24th (Asian time), HYPE was trading at approximately $40, marking an 8.1% rise in the past 24 hours and a nearly 19% jump from its weekly low. Despite this recent surge, the token remains about 33.6% below its year-to-date peak.
Recent Developments Fueling HYPE’s Momentum
Several key events have recently reignited investor interest and positive sentiment around the HYPE token.
Firstly, the popular U.S.-based trading platform Robinhood officially added HYPE to its offerings on October 23rd. This listing significantly broadens the token’s accessibility to a larger retail audience across the United States. A Robinhood listing typically enhances an asset’s visibility and can contribute to more stable demand over the long term.
Secondly, on the same day as the Robinhood announcement, Hyperliquid Strategies Inc. submitted an S-1 registration with the U.S. Securities and Exchange Commission (SEC). The company intends to raise up to $1 billion through a stock offering. Crucially, Hyperliquid Strategies Inc. disclosed plans to use a portion of these proceeds to purchase and stake HYPE tokens. This strategic move has generated considerable discussion and renewed enthusiasm within the Hyperliquid community.
Further bolstering HYPE’s positive trajectory is the recent disclosure by medical technology company ENDRA Life Sciences. ENDRA announced a $3 million purchase of HYPE tokens as part of its newly established digital asset treasury strategy. The company has indicated that these HYPE tokens will form the core of its active treasury management approach, signaling an increasing level of institutional confidence in the Hyperliquid ecosystem’s long-term utility and value proposition.
Technical Outlook: Falling Wedge and Potential Breakout
These fundamental catalysts coincide with a critical juncture in HYPE’s technical chart. The token has been forming a falling wedge pattern on the 4-hour chart since early September. This pattern is characterized by a series of progressively lower highs and lower lows, converging within a narrowing range. Historically, a breakout from a falling wedge pattern often indicates a bullish reversal and the potential for a significant price increase.
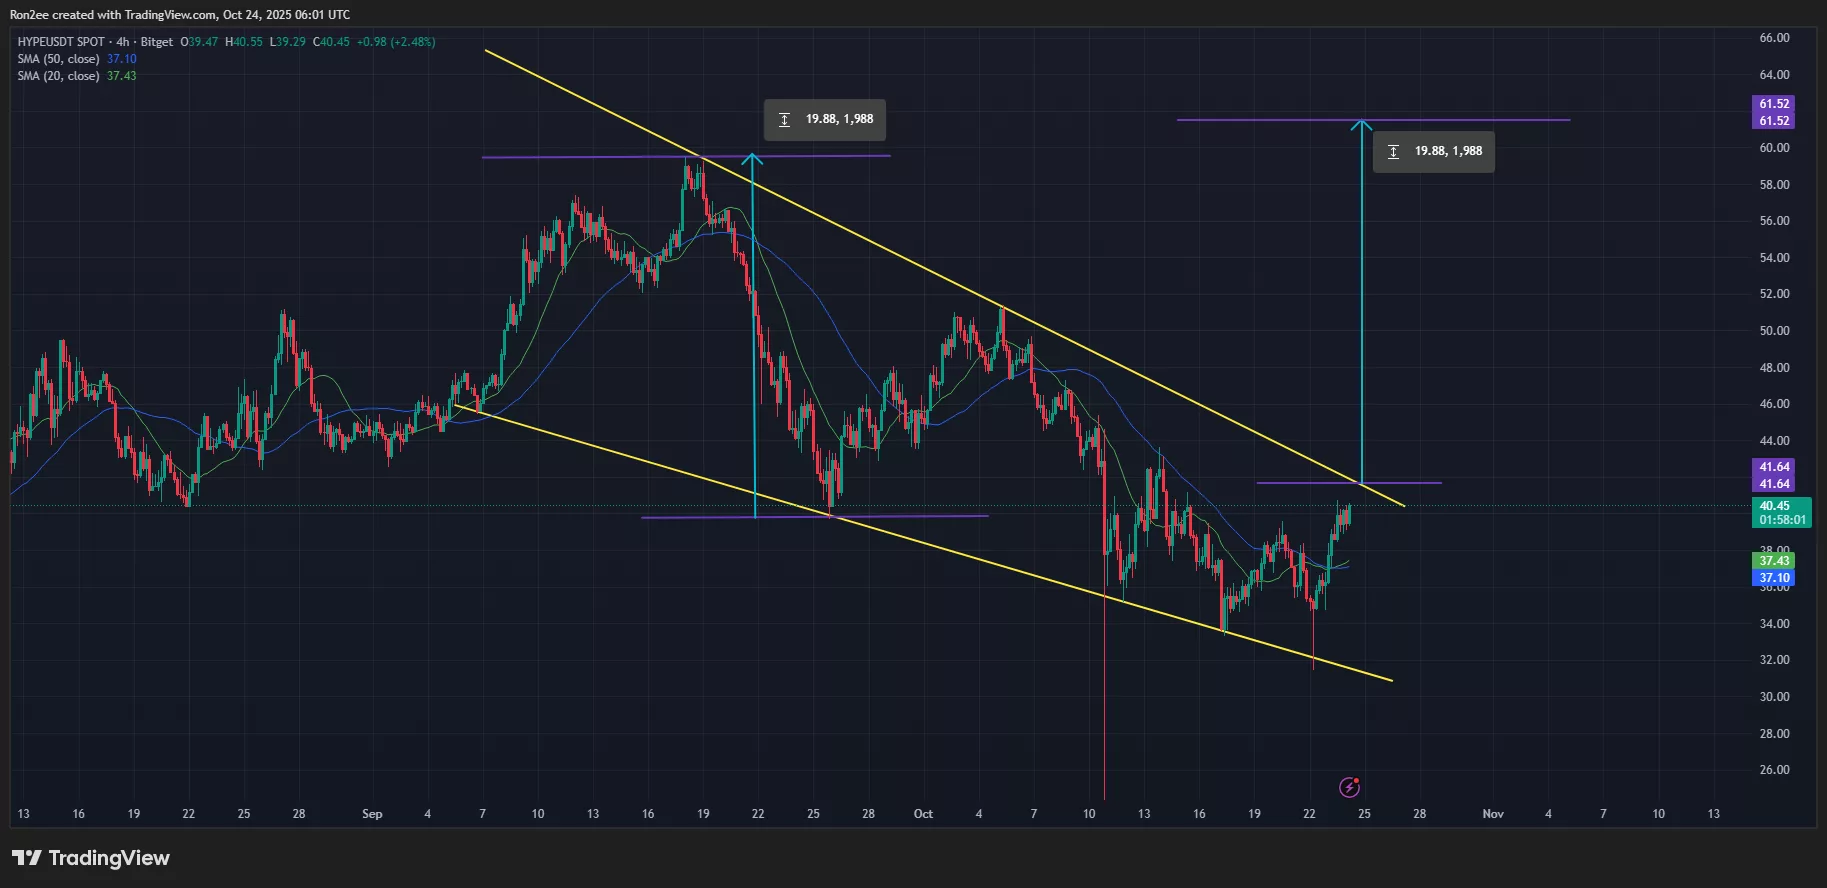
At the time of analysis, HYPE was trading near the upper boundary of this falling wedge, specifically in the $41 to $42 price zone. A decisive and strong move above this resistance level, confirmed by substantial trading volume, could provide the necessary momentum for bulls to target the $61.5 level. This target represents a potential 54% upside from the current price, calculated by projecting the height of the widest point of the wedge upwards from the breakout zone.
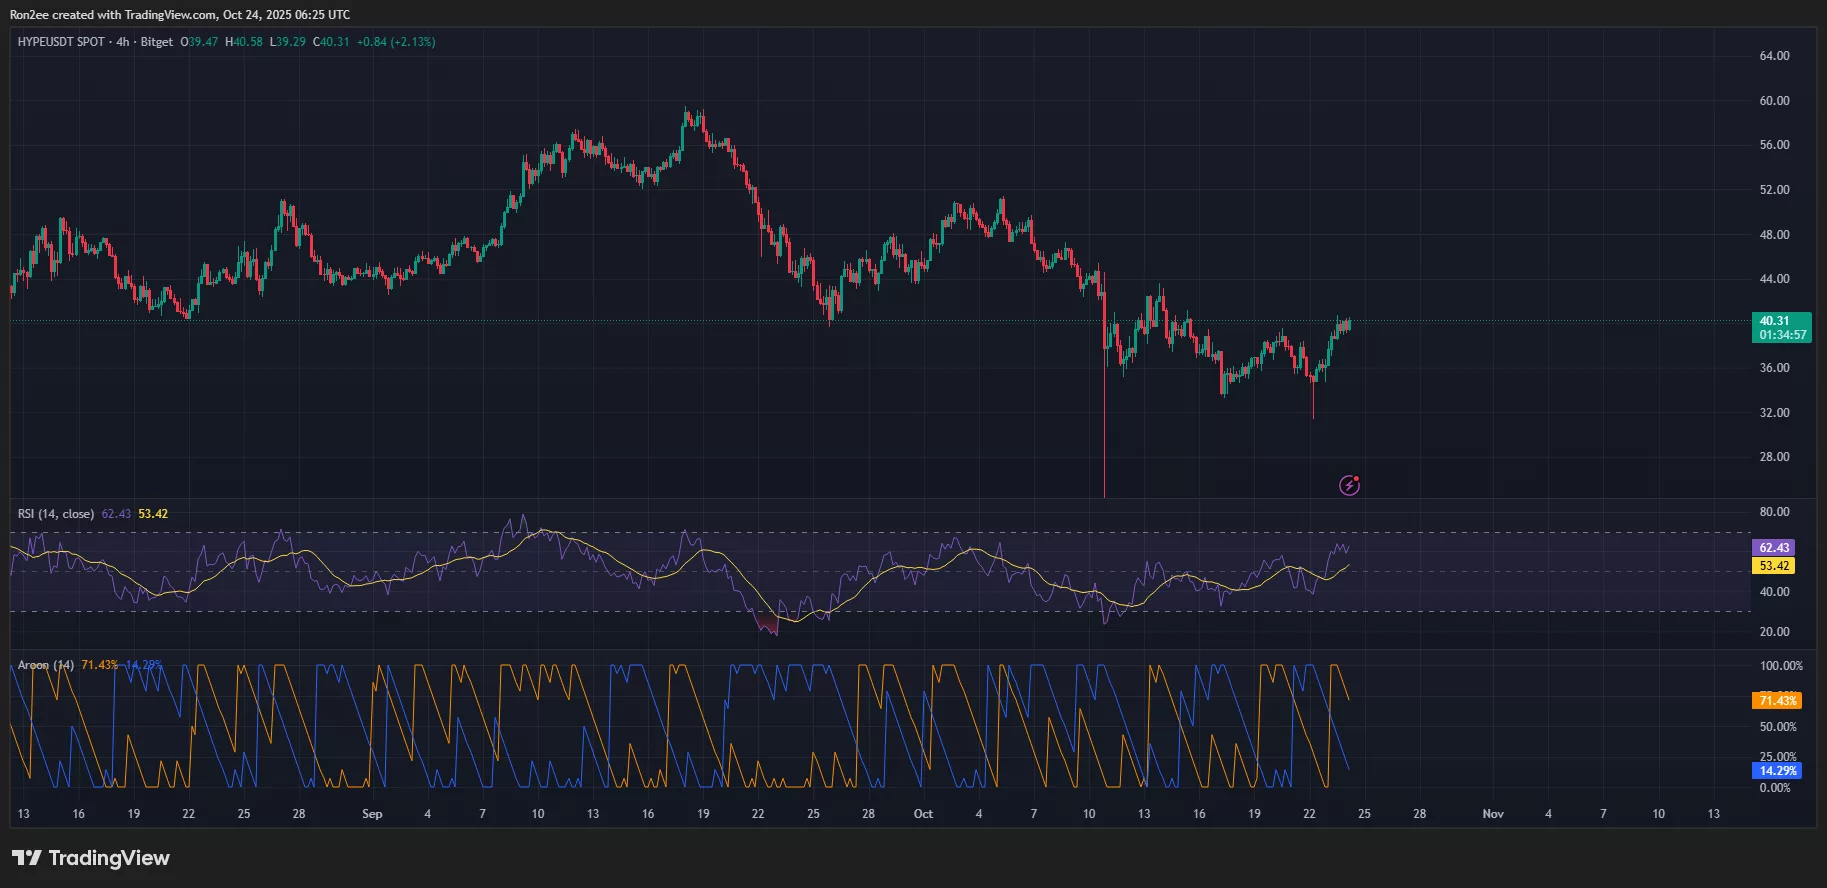
On-Chain Indicators Support Bullish Sentiment
Closer examination of technical indicators further supports the optimistic outlook for HYPE.
💡 The Aroon Up indicator registered at 71.4%, while the Aroon Down indicator stood at 14.29%. This suggests that buyers are currently exerting significant control over the market.
📊 The Relative Strength Index (RSI) has shown resilience, bouncing back from the neutral 50-level and remaining below the overbought territory. This indicates that there is still ample room for price appreciation before triggering immediate sell-off signals.
Liquidation Levels and Potential Price Drivers
The 24-hour liquidation heatmap from CoinGlass provides additional insights into potential price movements and volatility.
📍 A significant cluster of short liquidations is observed between the $41 and $42 range, aligning precisely with the upper trendline of the falling wedge. A strong breakout above this level could trigger a cascade effect, liquidating overleveraged short positions and rapidly driving the price higher, thereby amplifying the upward momentum.
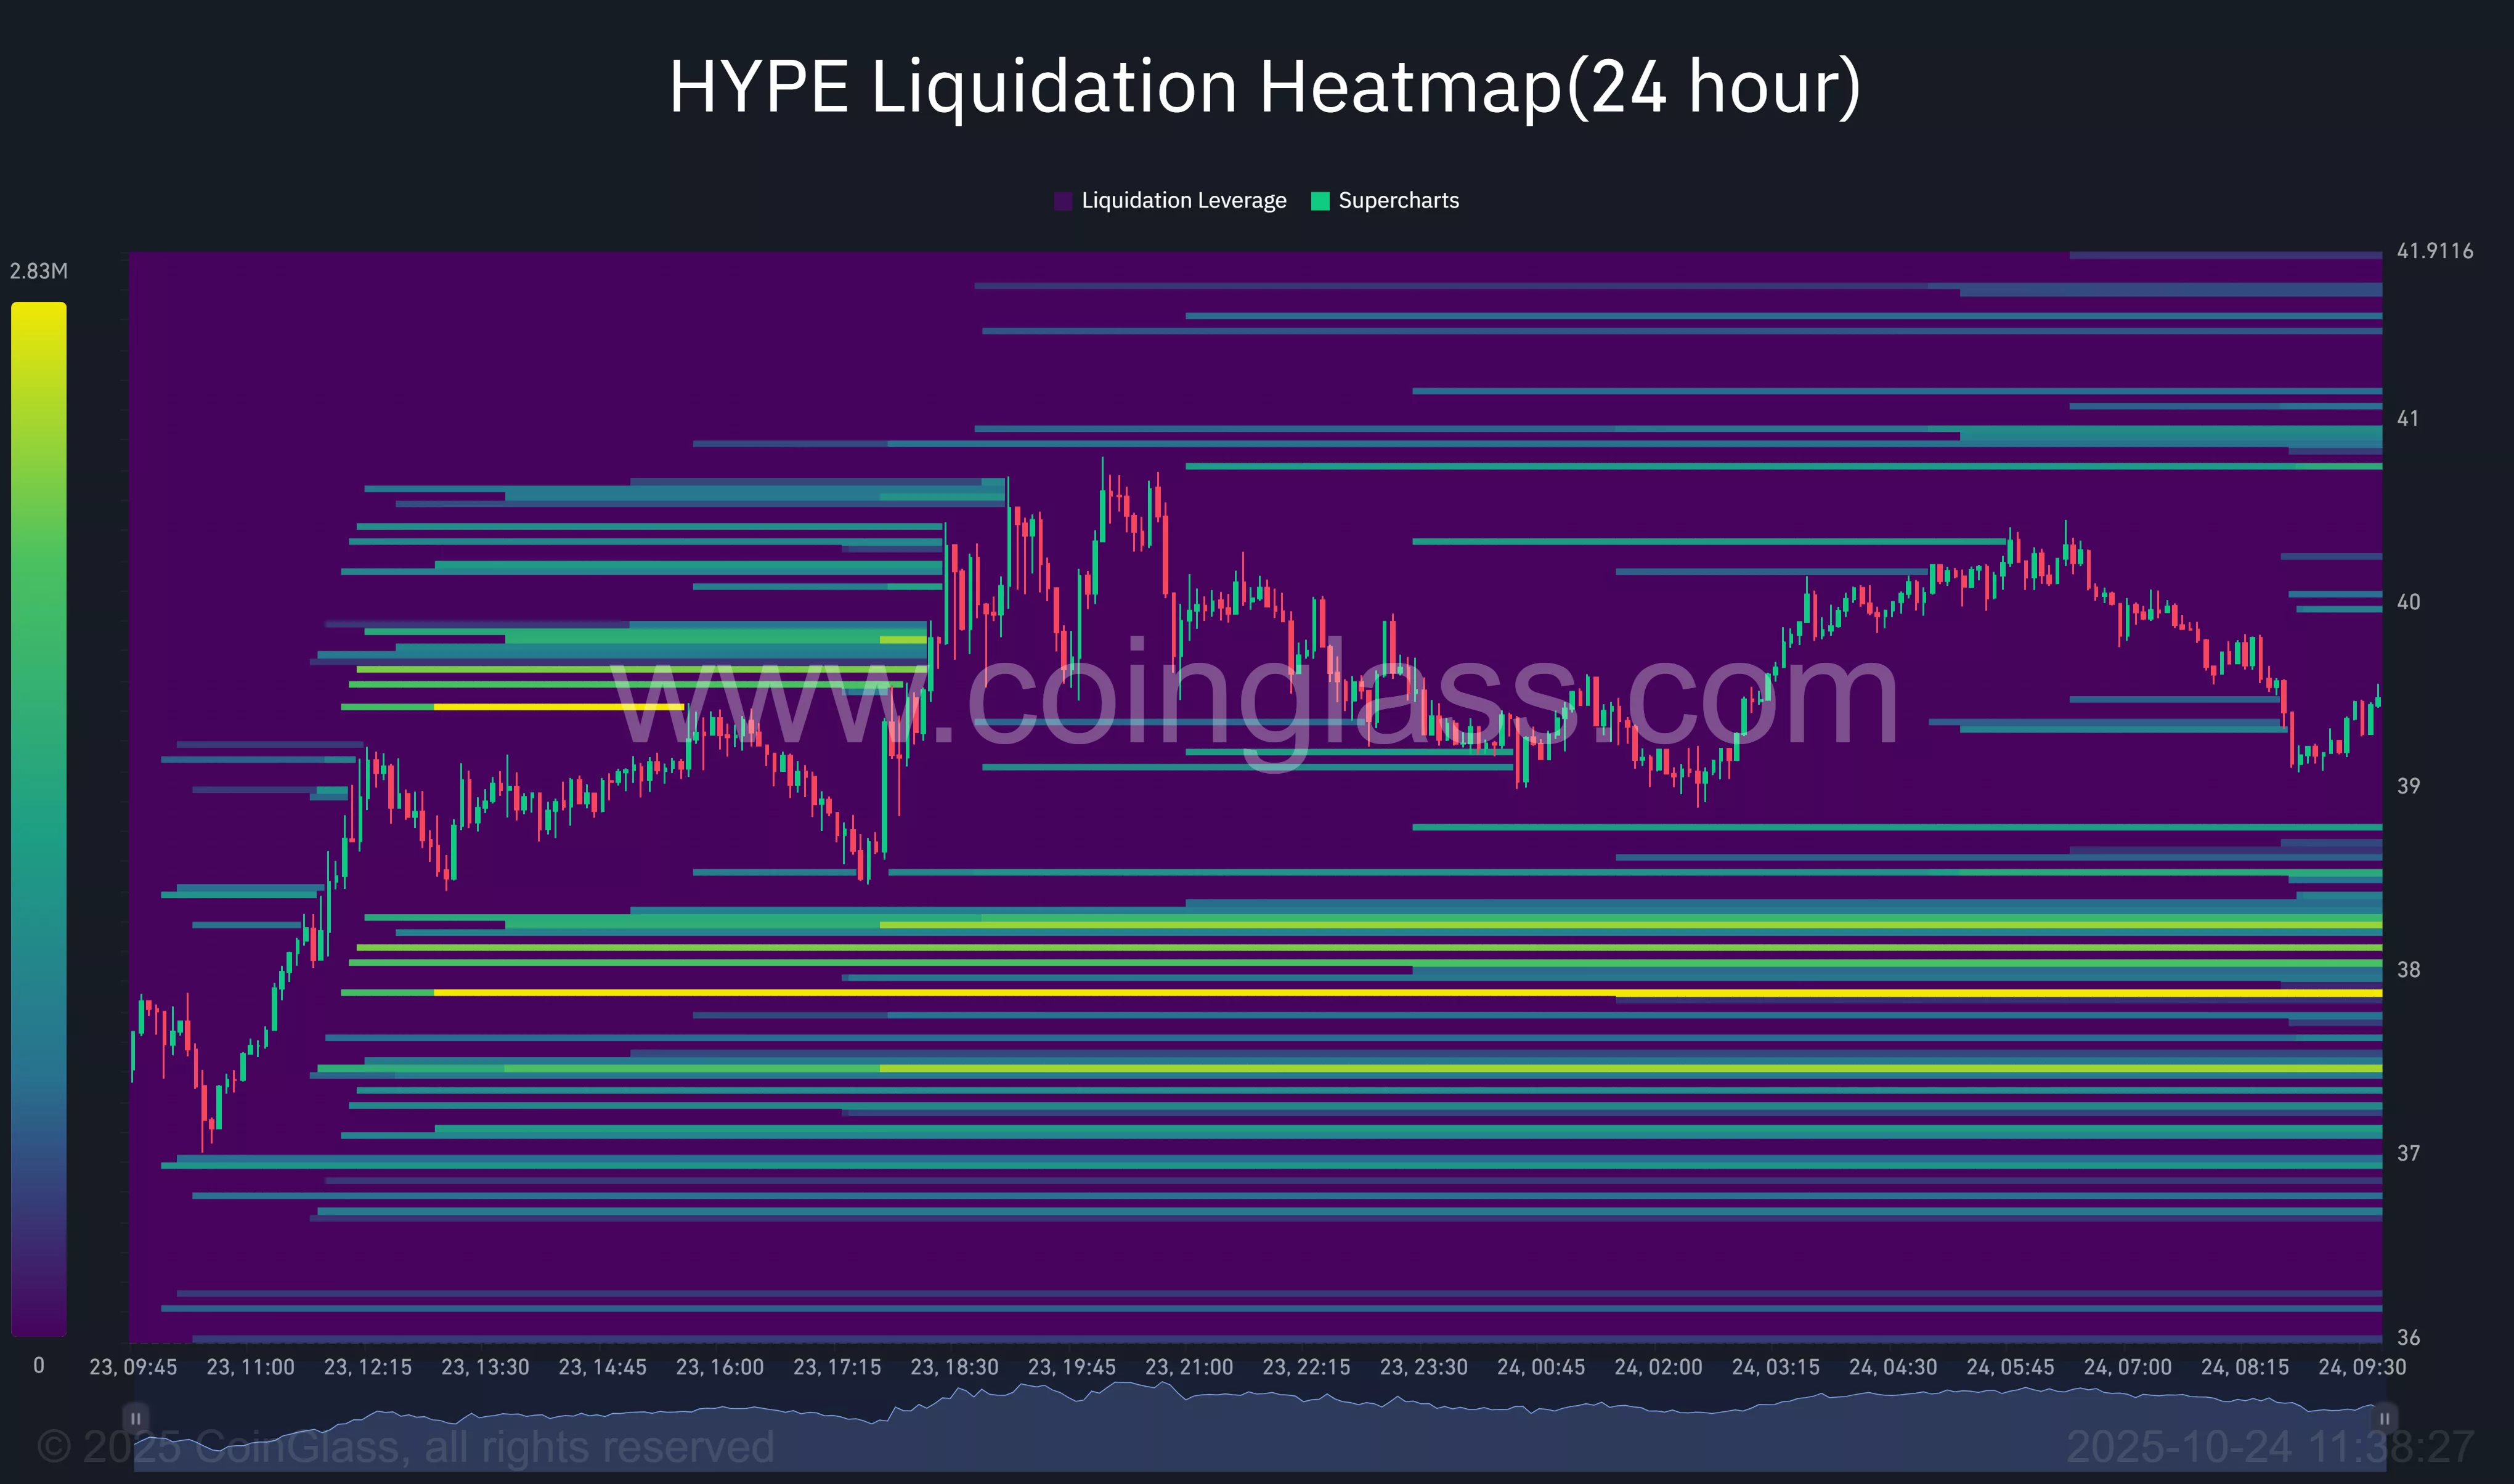
⚡ On the downside, a notable zone of liquidation activity exists between $38 and $36. This area could serve as a critical support level where buyers may step in to prevent further price declines. However, should HYPE fall below the $36 mark, the on-chain data suggests diminished trading activity and weaker support, which could lead to more pronounced price swings and a potentially faster descent.
Expert Summary
The HYPE token is positioned for a potential bullish breakout, supported by its listing on Robinhood, strategic fundraising efforts, and increasing institutional adoption. Technical indicators, including a falling wedge pattern and favorable RSI and Aroon readings, point towards upward momentum. While short-term resistance and liquidation levels warrant attention, the confluence of positive news and technical signals suggests a promising outlook for HYPE.