

Summary:
- Shiba Inu price dropped below $0.00001, leading to significant withdrawals from trading platforms.
- Open interest in SHIB futures has sharply declined, indicating reduced speculative activity.
- SHIB is currently trading within a descending triangle pattern, suggesting a potential breakout is imminent.
Shiba Inu (SHIB), the popular meme cryptocurrency, experienced a further decline of 4.28% during U.S. market hours on Wednesday. This selling pressure is attributed to weakening bullish momentum in the broader crypto market following a recent relief rally, raising concerns about continued corrections for many digital assets. The futures contracts tied to SHIB have seen a notable drop in open interest, while the coin’s price hovered precariously around the crucial $0.00001 psychological level, prompting questions about a potential major breakdown.
💡 It’s important to monitor these psychological price levels as they often act as key support or resistance points in cryptocurrency markets.
Volatility Reduces SHIB Leverage, While Exchange Outflows Suggest Possible Accumulation
In the past month, the price of Shiba Inu has undergone a significant correction, falling from a high of $0.00001484 to its current trading price of approximately $0.00001018, representing a substantial 31% loss. Consequently, SHIB’s market capitalization has also decreased, currently standing at $6.8 billion. Amidst this pullback, a considerable sell-off occurred on October 10th, which briefly pushed the asset’s value down to $0.00000678 before it managed to recover and trade back above the $0.00001 mark.
📍 The recovery above $0.00001 is a positive sign, but traders will be watching closely to see if it can hold as sustained support.
The heightened market volatility has resulted in massive liquidations of Shiba Inu (SHIB) futures contracts. This has cleared millions in leveraged positions and contributed to a sharp decline in the overall open interest for SHIB derivatives.
📊 According to data from Coinglass, SHIB’s total futures open interest has plummeted by 50% over the past two weeks, dropping from $206 million down to $103 million.
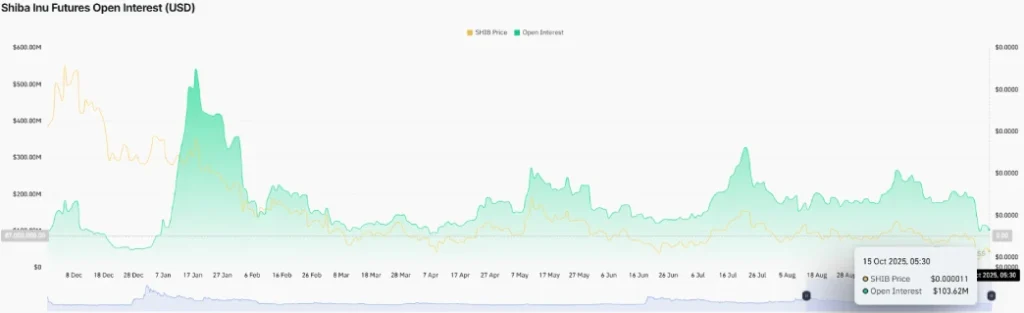
⚡ This significant contraction in open interest suggests that speculative trading activity has cooled considerably. Such a reset of market leverage can sometimes precede a period of reduced volatility, potentially forming a more stable price base if renewed buying interest emerges.
Despite widespread market apprehension, Shiba Inu (SHIB) saw notable negative spikes in its exchange net flow as its price approached a breakdown below the critical $0.00001 level.
✅ According to data from CryptoQuant, on October 10th, during a period marked by significant liquidation events across the crypto market, SHIB’s exchange net flow reached -903,075,035 tokens. This indicates a substantial volume of SHIB being withdrawn from exchanges. This trend continued the following day, with net flows falling further to -1,037,500,588 tokens, followed by another substantial outflow of -721,919,646 tokens on Sunday.
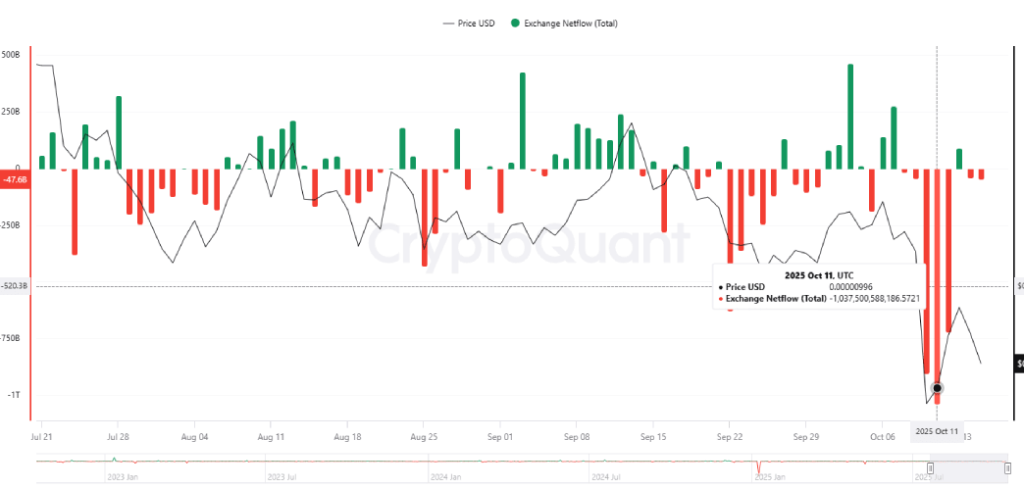
📌 These consistent negative net flow readings suggest that investors were increasingly moving their SHIB holdings off exchanges. This behavior could indicate a shift towards accumulation or simply a reduced intention to sell, even amidst prevailing market uncertainty.
Shiba Inu Price Forming Within a Key Triangle Pattern
Technical analysis of the daily chart reveals that the current correction phase for Shiba Inu is seeking support along the lower trendline of a descending triangle pattern. Since August 2024, this lower trendline has provided dynamic support, acting as a crucial zone for buyers to potentially regroup and initiate renewed bullish momentum.
💡 Descending triangle patterns are often watched closely by traders as they can signal potential trend continuations or reversals.
However, the pattern also features a declining upper trendline that has been capping upward price movements, acting as dynamic resistance and limiting buyers’ ability to drive SHIB to higher levels. Consequently, the Shiba Inu price is currently trading within these converging trendlines, indicating that a significant breakout move may be on the horizon.
📍 A sustained breakdown below the triangle’s lower trendline and the critical $0.00001 support level could accelerate selling pressure, potentially driving the price towards the next significant support at $0.00000844.
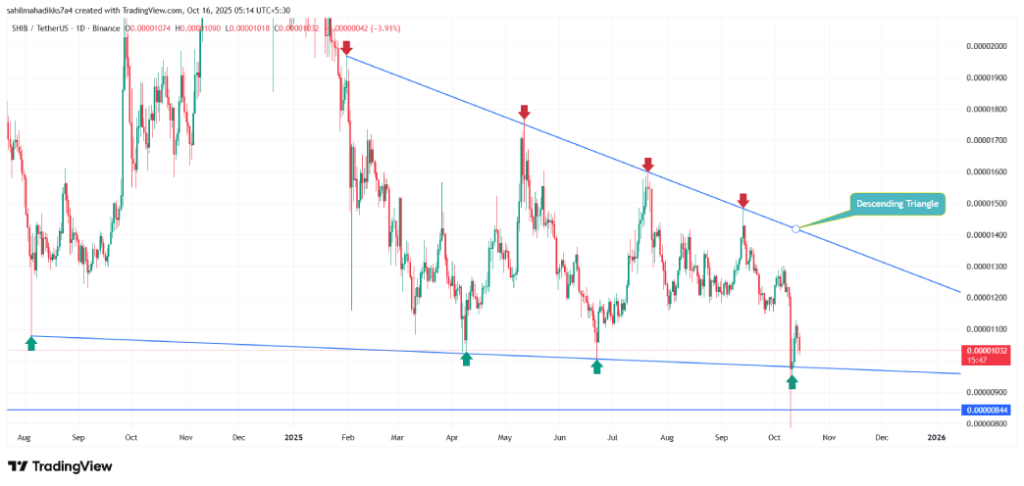
✅ Conversely, if consolidation allows for the build-up of sufficient buying pressure, a breakout above the overhead resistance trendline could signal a positive shift in SHIB’s market dynamics, potentially leading to a price increase.
Expert Summary
Shiba Inu is currently navigating a critical period, evident from significant fluctuations in its price and trading metrics. The substantial withdrawals from exchanges, coupled with a reduction in futures open interest, hint at reduced speculative fervor and potential accumulation by long-term holders. The price action, confined within a descending triangle pattern, suggests that a decisive breakout is likely imminent, with key levels to watch being the $0.00001 support and the pattern’s trendlines.