
Summary
- Small-cap stocks, defined as companies with market capitalizations between $250 million and $2 billion, offer significant growth potential despite higher associated risks.
- Key indices for small-cap stocks include the Russell 2000, S&P SmallCap 600, and MSCI USA Small-Cap Index.
- When evaluating small-cap stocks, investors should look for companies with disruptive advantages in high-growth sectors, strong EPS growth, and stock prices trading at a discount to analyst targets.
- While small-caps present opportunities, they also come with higher risks due to factors like unproven business models and greater market volatility.
- This analysis delves into the fundamentals and technicals of specific small-cap companies like Evolv Technologies Holdings (EVLV) and X Financial (XYF), outlining potential investment strategies.
Small-cap stocks often attract attention for significant price volatility, potential for fraudulent activities, and accounting irregularities. Consequently, many investors gravitate towards more established large-cap and mega-cap entities, exemplified by the Magnificent Seven. However, these smaller companies typically possess the most substantial growth prospects compared to their larger counterparts. Investors might therefore consider incorporating these less prominent underdogs into their portfolios.
💡 It’s crucial to distinguish between market capitalization ranges, as definitions can vary slightly across different financial institutions.
While a universally agreed-upon definition is absent, small-cap stocks are generally recognized as publicly traded companies with market capitalizations ranging from $250 million to $2 billion. Market capitalization, often referred to as cap, is calculated by multiplying the total number of outstanding shares by the current share price. For instance:
- If Company XY2 has 50 million shares outstanding and each share is trading at $10, its market capitalization is $500,000,000 (50 million shares x $10 per share).
The Russell 2000 index is a prominent benchmark for small-cap equities, tracking approximately 2,000 companies with market values typically between $240 million and $6 billion. Some observers note that certain constituents of the Russell 2000 may have surpassed the typical small-cap threshold due to the sustained equity bull market. Other notable small-cap indices include the S&P SmallCap 600 and the MSCI USA Small-Cap Index.
✅ Understanding the official classifications helps investors align their research with recognized market segments.
The Financial Industry Regulatory Authority (FINRA) provides the following classifications for stock market capitalizations:
- Small-cap stocks: Market capitalization from $250 million to $2 billion.
- Mid-cap stocks: Market capitalization above $2 billion but below $10 billion.
- Large-cap stocks: Market capitalization exceeding $10 billion.
Why Consider Small-Cap Stocks?
Small-cap stocks present compelling investment narratives, often driven by innovative technologies and services, offering significant portfolio diversification benefits and the potential for above-average growth. However, investors must be prepared to accept higher levels of risk.
📌 When evaluating potential small-cap investments, consider these factors:
- Identify companies with products or services in high-growth sectors that possess a distinct disruptive advantage.
- Prioritize small-cap companies demonstrating annualized Earnings Per Share (EPS) growth of 25% or more.
- Look for opportunities where the current stock price trades at a discount to the average analyst price target.
- Consider allocating small-cap investments to a separate portfolio to manage risk effectively and avoid diluting the impact of other holdings.
What Are the Risks Associated with Small-Cap Stocks?
Investing in small-cap stocks inherently involves greater risk, stemming from factors such as unproven business models, less robust balance sheets, and more challenging operating environments. The size of these companies often reflects underlying uncertainties. Investors must also be prepared for increased market volatility.
📊 Here is a selection of small-cap stocks that warrant consideration:
- DigitalBridge Group (DBRG)
- Teradata Corporation (TDC)
- Lithium Americas Corporation (LAC)
- Consolidated Water (CWCO)
- Evolv Technologies Holdings (EVLV)
- SES AI Corporation (SES)
- Innodata (INOD)
- Xunlei (XNET)
- Serve Robotics (SERV)
- X Financial (XYF)
Update on Previously Recommended Small-Cap Stocks
In a prior analysis, the potential upside of DigitalBridge Group and Teradata Corporation was highlighted.
DigitalBridge Group (DBRG): A long position was established in DBRG between $9.06 and $9.84. The stock subsequently rallied over 33%, and the position was closed at $13.50. Although the price has seen a correction to its ascending 38.2% Fibonacci Retracement Level, a re-entry is not currently planned.
Teradata Corporation (TDC): A long position was initiated in TDC between $20.15 and $20.97. The stock advanced by more than 13%, and the stop-loss order secured a profit at $22.50, just shy of a 10% gain. The recent correction has brought the price back within the previous buy zone, indicating a potential opportunity for a second trade.
⚡ This update demonstrates the importance of dynamic portfolio management and adapting to market movements.
Evolv Technologies Holdings (EVLV): Fundamental Analysis
Evolv Technologies Holdings specializes in AI-driven, non-invasive advanced security technology and screening solutions. The company aims to revolutionize physical security with sophisticated, scalable solutions tailored for environments such as schools, stadiums, transit hubs, and corporate offices.
The bullish outlook on EVLV persists despite its price doubling since April, driven by the nascent but rapidly expanding market for non-invasive AI-based security. Anticipated demand is expected to substantially outpace supply. The addressable market for Evolv Technologies Holdings is growing, which should fuel double-digit revenue growth. Furthermore, EVLV has reported positive cash flow from operations, boasts industry-leading gross margins, and exhibits impressive earnings-per-share growth.
| Metric | Value | Verdict |
| P/E Ratio | Unavailable | Bearish |
| P/B Ratio | 13.93 | Bearish |
| PEG Ratio | Unavailable | Bearish |
| Current Ratio | 0.93 | Bearish |
| Return on Assets | -31.52% | Bearish |
| Return on Equity | -95.40% | Bearish |
| Profit Margin | Unavailable | Bearish |
| ROIC-WACC Ratio | Unavailable | Bearish |
| Dividend Yield | 0.00% | Bearish |
Evolv Technologies Holdings Fundamental Analysis Snapshot
EVLV’s Price-to-Earnings (P/E) ratio is currently unavailable due to negative earnings. For context, the P/E ratio for the S&P 500 Index stands at 29.79.
The average analyst price target for Evolv Technologies Holdings is $9.50, suggesting considerable upside potential with manageable downside risks.
💡 While fundamental metrics present some concerning figures, the growth prospects in its niche market remain a key driver.
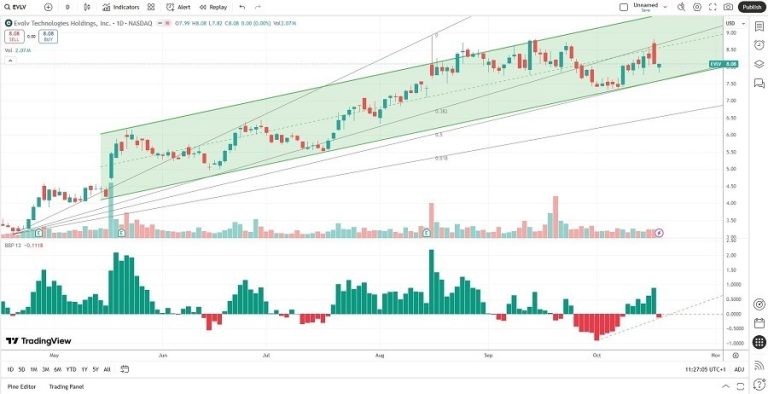
Evolv Technologies Holdings (EVLV): Technical Analysis

Evolv Technologies Holdings Price Chart
- The daily chart for EVLV shows its price action oscillating between the ascending 38.2% and 50.0% Fibonacci Retracement Fan levels.
- The stock is currently trading within a bullish price channel.
- The Bull Bear Power Indicator has turned bearish but is nearing its ascending trendline.
Investment Recommendation for Evolv Technologies Holdings
A long position is recommended for EVLV, with an entry range between $7.82 and $8.20. The conviction is based on the expectation that EVLV will secure additional long-term contracts with healthcare facilities and educational institutions. Furthermore, ongoing technological advancements and product updates are anticipated to enhance client retention rates.
✅ Acknowledging both technical and fundamental signals is key for well-rounded investment decisions.
X Financial (XYF): Fundamental Analysis
X Financial is a Chinese FinTech platform that facilitates loans by connecting borrowers on its platform with institutional funding partners. Leveraging its big-data-driven technology, XYF has forged numerous strategic partnerships with financial institutions.
The company’s attractiveness persists despite a recent pullback, driven by its effective use of technology to originate loans to prime borrowers. XYF employs robust risk assessment and control systems. A significant portion of the company, 54%, is held by the top three shareholders, with the CEO owning a substantial 43% stake, indicating limited institutional shareholding. This ownership structure means investing in X Financial is essentially investing in the vision of its CEO, who has demonstrated remarkable performance, evidenced by operational statistics that rank at the top of its industry.
| Metric | Value | Verdict |
| P/E Ratio | 2.67 | Bullish |
| P/B Ratio | 0.54 | Bullish |
| PEG Ratio | Unavailable | Bearish |
| Current Ratio | 1.59 | Bearish |
| Return on Assets | 12.77% | Bullish |
| Return on Equity | 22.63% | Bullish |
| Profit Margin | 23.29% | Bullish |
| ROIC-WACC Ratio | Positive | Bullish |
| Dividend Yield | 3.54% | Bullish |
X Financial Fundamental Analysis Snapshot
With a P/E ratio of 2.67, XYF appears to be an inexpensive stock, especially when compared to the S&P 500 Index’s P/E ratio of 29.79.
The average analyst price target for X Financial is $15.00, suggesting moderate upside potential with diminishing downside risks.
💡 The combination of strong valuation metrics and a solid dividend yield makes XYF an attractive proposition in the small-cap space.
X Financial (XYF): Technical Analysis

X Financial Price Chart
- The daily chart for XYF indicates that the price action is trading above its descending Fibonacci Retracement Fan.
- X Financial appears to be entering a significant horizontal support zone.
- The Bull Bear Power Indicator is bearish but is holding within its ascending support level.
Investment Recommendation for X Financial
A long position is advised for XYF, with an entry range set between $11.62 and $13.20. XYF stands out due to its excellent operational statistics, a deep understanding of its market, effective shareholder value creation, and a commendable dividend yield, which is uncommon for a small-cap stock. XYF is arguably one of the most undervalued stocks analyzed this year.
📊 Considering XYF’s financial health, growth potential, and dividend payout, it presents a compelling case for inclusion in a diversified portfolio.

Fundfa Insight
Small-cap stocks, while presenting higher risks, offer distinct growth opportunities that can significantly enhance portfolio performance when strategically selected and managed. Thorough fundamental and technical analysis, as demonstrated with EVLV and XYF, is crucial for navigating this segment of the market effectively. Investors should consider these smaller companies for their potential to disrupt industries and deliver outsized returns over the long term, balanced with a clear understanding of their inherent volatility.