
Key Takeaways
- The Tellor price prediction suggests a potential high of $41.87 by the close of 2025.
- Projections for 2028 indicate a price range between $33.96 and $44.09, averaging around $36.26.
- By 2031, Tellor’s price is expected to fluctuate between $60.43 and $72.73, averaging approximately $66.43.
Understanding Tellor (TRB)
The cryptocurrency market is known for its inherent volatility, a characteristic that can impact the stability of the Decentralized Finance (DeFi) sector and lead to significant liquidation events. While TRB price predictions can vary, ongoing development and adoption could potentially drive the value of Tellor higher.
Overview: Tellor (TRB) Digital Asset
| Cryptocurrency | Tellor |
| Ticker | TRB |
| Current Price | $24.84 |
| Market Cap | $67.70M |
| Trading Volume (24h) | $27.77M |
| Circulating Supply | 2.74M TRB |
| All-Time High | $593.09 (December 31, 2023) |
| All-Time Low | $0.01 (November 19, 2019) |
| 24-Hour High | $25.98 |
| 24-Hour Low | $23.56 |
Tellor Price Prediction: Technical Analysis Insights
Technical indicators provide a snapshot of market sentiment and potential price movements. The Fear and Greed Index currently stands at 34, indicating a state of Fear among investors.
| Indicator | Value |
| Volatility (30-day variation) | 13.73% (Very High) |
| 50-day Simple Moving Average (SMA) | $30.89 |
| 200-day Simple Moving Average (SMA) | $34.48 |
| Sentiment | Bearish |
| Fear and Greed Index | 34 (Fear) |
| Green Days (last 30) | 15 (50%) |
Tellor Price Analysis: Current Market Trends
TL; DR Breakdown:
- TRB is currently consolidating around the $25 mark, having found support at the $23.30 level.
- A confirmed break above $25.50 could lead to a move towards the $26.80 resistance.
TRB/USD 1-Day Chart Analysis
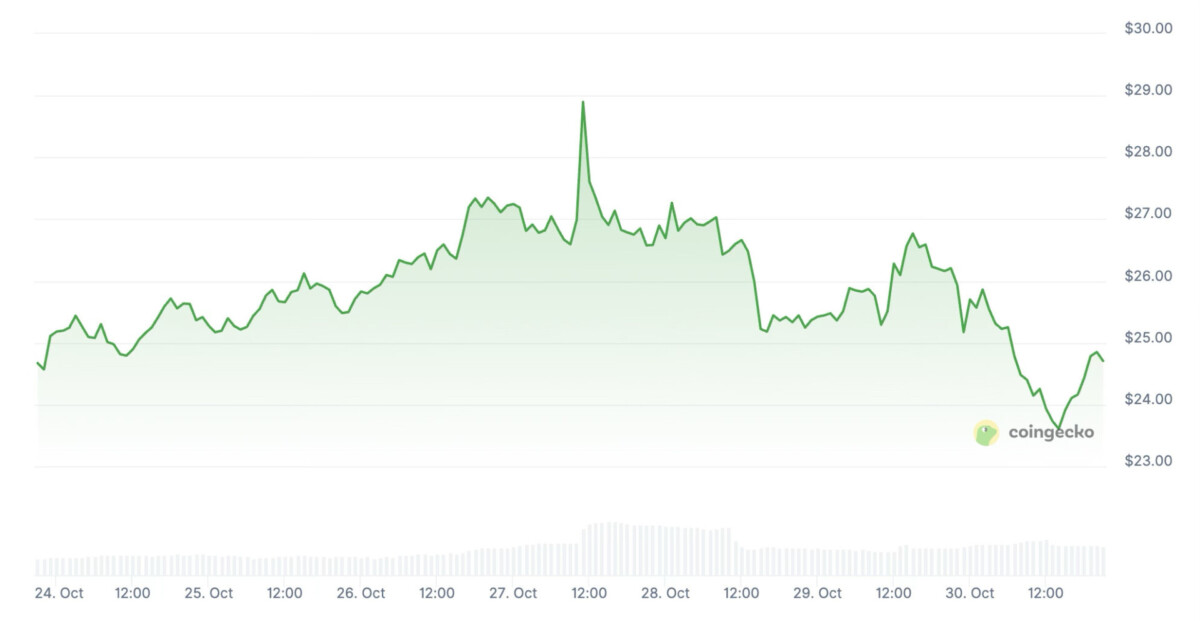
As of October 31, Tellor (TRB) is trading at approximately $24.75, showing a slight increase for the day. Bulls are attempting to maintain support at the lower Bollinger Band, situated around $23.30, while the upper band is near $27.57. The narrowing of the Bollinger Bands suggests a period of reduced volatility following a recent correction.
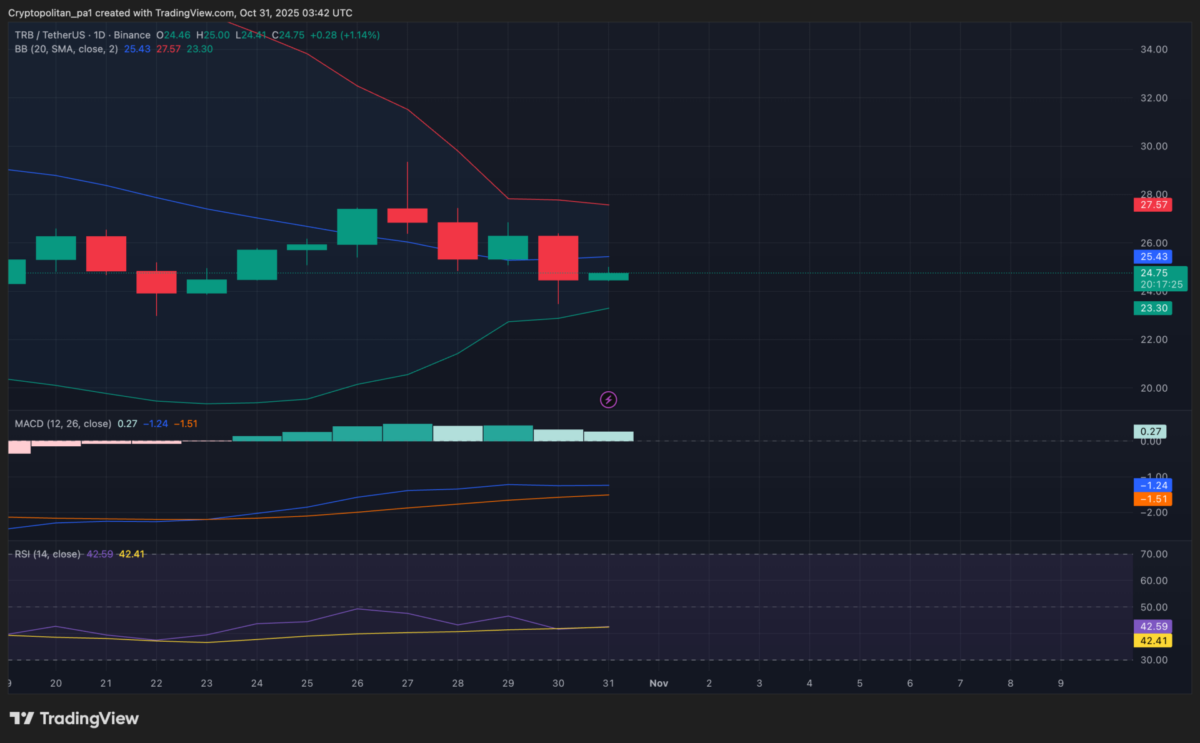
The Moving Average Convergence Divergence (MACD) indicates a mild bullish crossover, with the MACD line at 0.27, hinting at potential short-term upward momentum. However, the histogram and the Relative Strength Index (RSI) at 42.41 are subdued, suggesting the market is in an accumulation phase rather than a strong uptrend. Key support levels are identified between $23.30–$24.00. Holding this zone could initiate a recovery towards $25.40–$26.00. Conversely, a daily close below $23.30 might lead to a pullback towards $22.00.
TRB 4-Hour Price Analysis
On the 4-hour chart, TRB is trading around $24.84, reflecting a modest gain after bouncing from the $24.40 zone. The downward slope of the Alligator indicator lines suggests that short-term momentum remains weak. However, recent green candles indicate an early attempt at recovery.
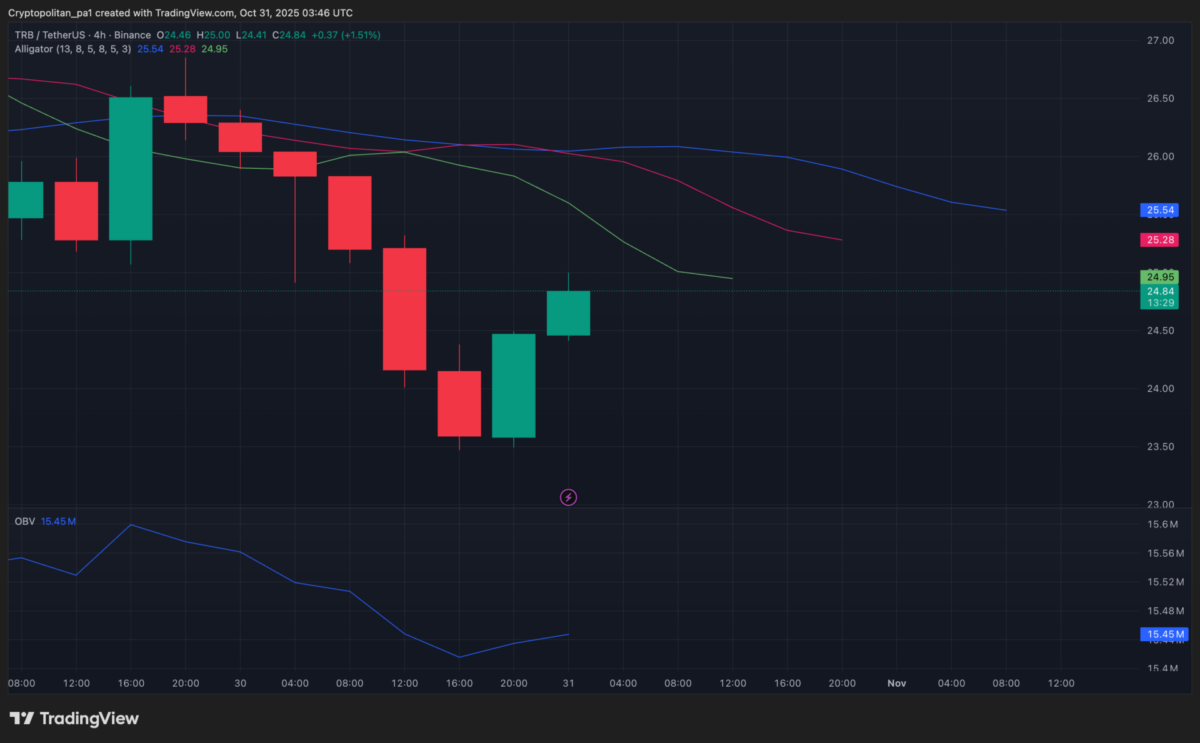
The On-Balance Volume (OBV) shows a slight uptick, suggesting an increase in buying volume after a prior decline. Resistance at $25.50 is a critical level; a decisive break above it could target $26.20–$26.80. Failure to overcome this resistance may result in another test of the $24.40 support level.
Tellor Technical Analysis: Key Levels and Action
Daily Simple Moving Average (SMA)
| Period | Value | Action |
|---|---|---|
| SMA 3 | $28.99 | SELL |
| SMA 5 | $28.17 | SELL |
| SMA 10 | $27.24 | SELL |
| SMA 21 | $26.54 | SELL |
| SMA 50 | $30.89 | SELL |
| SMA 100 | $33.69 | SELL |
| SMA 200 | $34.48 | SELL |
Daily Exponential Moving Average (EMA)
| Period | Value | Action |
|---|---|---|
| EMA 3 | $27.65 | SELL |
| EMA 5 | $29.20 | SELL |
| EMA 10 | $31.26 | SELL |
| EMA 21 | $33.38 | SELL |
| EMA 50 | $35.79 | SELL |
| EMA 100 | $36.96 | SELL |
| EMA 200 | $39.78 | SELL |
What to Expect from TRB Price Analysis Next
TRB is showing early signs of stabilization after a recent price decline. Maintaining above the $24 level could lead to a modest short-term recovery. However, a more significant bullish trend will likely require a breakout above the $26 resistance mark to confirm renewed upward momentum.
Is TRB a Good Investment?
For investors who believe in the potential of decentralized oracle networks and the broader growth of Web3 infrastructure, TRB could present an interesting opportunity. Its utility, coupled with a limited supply, offers potential for long-term value appreciation. Nonetheless, TRB remains a high-risk asset due to intense competition, relatively low liquidity, and the inherent volatility of the cryptocurrency market. A cautious approach is recommended.
Why is TRB Price Down?
Recent downward price action in TRB can be attributed to a general cooling of sentiment in the broader cryptocurrency market, leading traders to seek more stable assets. Additionally, low liquidity and reports of significant sell-offs by whales have likely contributed to increased volatility and selling pressure.
Will TRB Recover?
The Tellor platform’s continued development and the announcement of new partnerships offer potential catalysts for a future recovery. These developments could draw renewed interest from investors, especially as overall market sentiment improves.
Will TRB reach $50?
Reaching $50 for TRB is a plausible target, particularly within a strong bullish market phase. This outcome would likely be driven by increased demand for Tellor’s oracle services and a positive shift in the general crypto market sentiment.
Will TRB reach $100?
Achieving $100 for TRB is possible but less certain in the short to medium term. Such a significant price increase would likely require substantial adoption of the Tellor network, sustained investor interest, and powerful market momentum across the cryptocurrency landscape.
Will TRB reach $500?
Reaching $500 for TRB appears highly unlikely under current market conditions. This would necessitate widespread global adoption and a major bull cycle lifting the entire crypto market to unprecedented levels.
Does Tellor Have a Good Long-Term Future?
The long-term outlook for TRB appears positive, with expectations of price appreciation over the coming years. However, unforeseen factors such as significant market downturns or adverse regulatory changes could potentially challenge this optimistic projection.
TRB Price Prediction: November 2025
For November 2025, the Tellor price is projected to trade within a range of $20.07 to $38.87, with an anticipated average price of $32.02.
| Month | Potential Low ($) | Potential Average ($) | Potential High ($) |
| November 2025 | 20.07 | 32.02 | 38.87 |
TRB Price Predictions: 2025
By the end of 2025, Tellor’s price is forecast to trade between $14.22 and $41.26, with an estimated average price of $27.07.
| Year | Potential Low ($) | Potential Average ($) | Potential High ($) |
| 2025 | 14.22 | 27.07 | 41.26 |
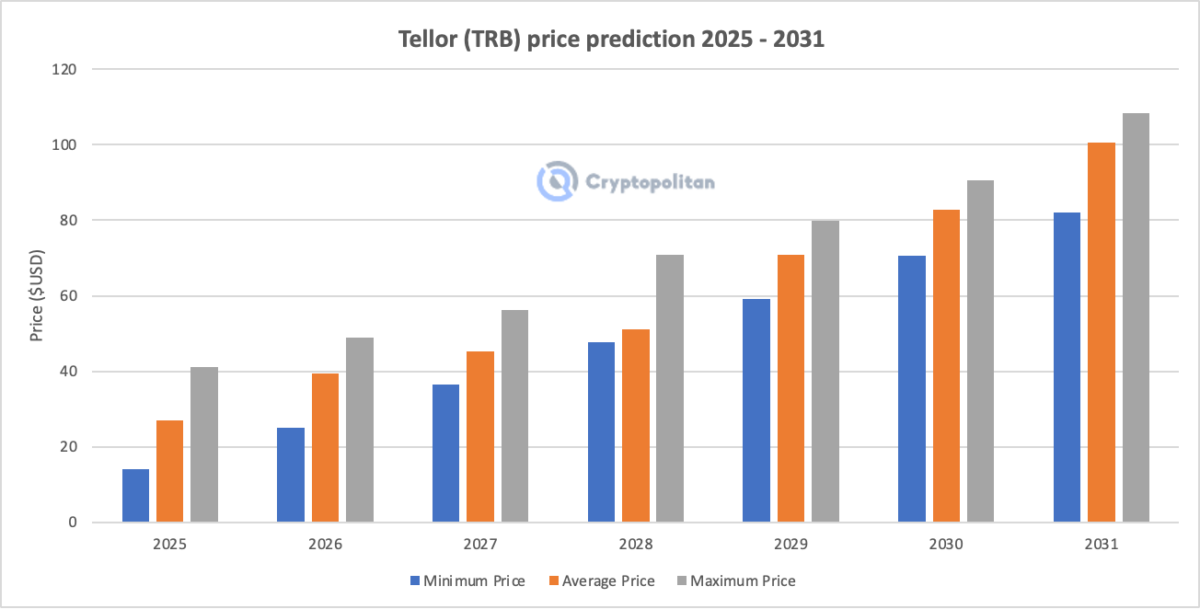
Tellor Price Predictions: 2026-2031
Future price projections for Tellor (TRB) and expected trading ranges:
| Year | Minimum Price ($) | Average Price ($) | Maximum Price ($) |
| 2026 | 25.06 | 39.54 | 48.84 |
| 2027 | 36.44 | 45.35 | 56.25 |
| 2028 | 47.82 | 51.17 | 70.86 |
| 2029 | 59.22 | 70.98 | 79.86 |
| 2030 | 70.60 | 82.80 | 90.66 |
| 2031 | 81.98 | 100.62 | 108.46 |
Tellor Price Prediction 2026
The Tellor price prediction for 2026 suggests a maximum price of $48.84, with a minimum price of $25.06 and an average trading price of $39.54.
Tellor Price Prediction 2027
The Tellor price forecast for 2027 indicates a trading range between $36.44 and $56.25, aiming for an average price of $45.35.
Tellor Price Prediction 2028
For 2028, the Tellor price is projected to fluctuate between $47.82 and $70.86, with an average price of $51.17.
Tellor Price Prediction 2029
Our Tellor price prediction estimates trading within the $59.22 to $79.86 range for 2029, averaging around $70.98.
Tellor TRB Price Prediction 2030
The TRB coin price prediction for 2030 forecasts a minimum price of $70.60 and a maximum price of $90.66, with an average price of $82.80.
TRB Price Prediction 2031
According to the Tellor price prediction for 2031, TRB’s price is expected to range from $81.98 to $108.46, with an average price of $100.62.
Tellor Market Price Prediction: Analyst Forecasts for TRB
| Firm | 2025 | 2026 |
| Digitalcoinprice | $54.34 | $63.51 |
| Coincodex | $42.24 | $112.79 |
Cryptopolitan’s TRB Price Prediction
A summary of Cryptopolitan’s predictions indicates TRB might trade between $25 and $35 by the end of 2025, averaging around $27.21. For 2031, the forecast suggests a range of $50 to $60, with an average of $54. These predictions are not to be taken as investment advice, and conducting independent research is encouraged.
Tellor Historic Price Sentiment
Historic Price Movements:
- Tellor (TRB) saw a significant surge from around $20 to $75 in 2020 following its Binance listing, later consolidating around $25. It experienced another rally in 2021, reaching a peak of $123.76 after its Coinbase debut, before declining as the market cooled.
- In 2022, TRB briefly exceeded $60 but closed the year near $12 amidst a bearish market sentiment.
- After bottoming below $20 in mid-2023, TRB showed strong recovery potential, reaching an all-time high of $216.74 on January 1, 2024, before retracting to approximately $70 later that year.
- Throughout 2025, the coin has traded within a range of $30 to $45, indicating a period of consolidation as momentum has waned, awaiting new market catalysts. At the time of this writing in October 2025, TRB is observed trading between $23.56 and $26.27.
Final Thoughts on Tellor (TRB)
Tellor’s price trajectory indicates potential for growth, supported by its role in the decentralized oracle network space. While current market conditions present challenges, future developments and broader market trends will be key factors in its performance. Investors should carefully consider the inherent risks and conduct thorough research before making any investment decisions.