
At a Glance
- US private sector activity expanded robustly in October, with the S&P Global Composite PMI rising to 54.8 in the flash estimate.
- Both the Manufacturing PMI (52.2) and Services PMI (55.2) showed improvement, exceeding analyst expectations.
- This economic growth momentum is observed at the beginning of the fourth quarter, despite some business interruptions from the government shutdown.
- The US Dollar Index saw a slight recovery following the positive PMI data, trading mostly flat on the day.
US Economic Activity Accelerates in October
The United States witnessed a healthy expansion in its private sector business activity during October. The S&P Global Composite Purchasing Managers’ Index (PMI) recorded an improved flash estimate of 54.8, up from 53.9 in September. This indicates a strengthening economic trend as the fourth quarter begins.
The manufacturing sector contributed to this positive trend, with the S&P Global Manufacturing PMI increasing to 52.2 from 52 in the previous month. Simultaneously, the services sector demonstrated even stronger growth, with the Services PMI climbing to 55.2 from 54.2.
Both of these figures surpassed analysts’ forecasts, suggesting that the underlying drivers of economic activity remain robust.
Expert Analysis of PMI Data
Chris Williamson, Chief Business Economist at S&P Global Market Intelligence, commented on the October flash PMI data. He highlighted that the readings point to sustained strong economic growth at the start of the fourth quarter.
💡 Williamson noted that business activity picked up momentum across both manufacturing and services sectors. He acknowledged reports of businesses being adversely impacted by the government shutdown but stated that overall growth momentum continued.
Market Reaction to US PMI Data
Following the release of the upbeat US PMI data, the US Dollar Index experienced a slight recovery from its session lows. The index was observed trading flat on the day at 98.94, indicating a mixed yet stable reaction in currency markets.
US Flash S&P Global PMI Overview
The preliminary United States (US) S&P Global Purchasing Managers’ Index (PMI) data for October was released, providing insights into the private sector’s performance. The report indicated that overall business activity in the private sector grew at a moderate pace.
📍 The Manufacturing PMI was expected to remain steady at 52.0. For the services sector, activities were forecast to expand again, albeit at a more moderate pace. The Services PMI was projected slightly lower than the previous month, estimated at 53.5 compared to 54.2 in September.
Potential Impact of US Flash PMI on EUR/USD
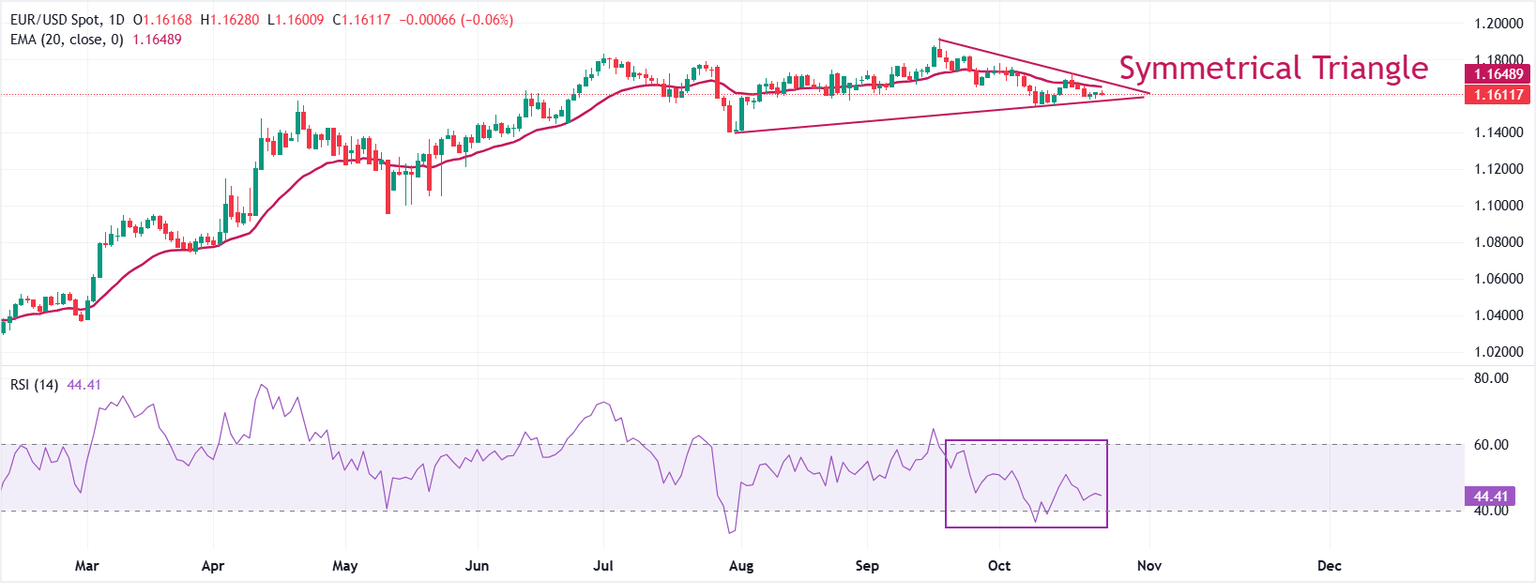
The EUR/USD pair was trading in a tight range slightly above 1.1600 during the late European trading session. The currency pair has demonstrated a broader sideways trend, forming a symmetrical triangle chart pattern, suggesting investor indecision.
📌 The upper boundary of this pattern is defined by the September 17 high around 1.1920, while the lower boundary is drawn from the August low near 1.1390. The pair has been trading close to the 20-day Exponential Moving Average (EMA) for several weeks, reinforcing the outlook of indecisiveness among investors.
📊 The 14-day Relative Strength Index (RSI) has been oscillating within the 40.00-60.00 range, indicating a contraction in volatility. This suggests a potential for a breakout once the market participants establish a clear direction.
⚡ If the EUR/USD pair breaks above the October 17 high of 1.1728, it could potentially revisit its four-year high around 1.1920. Conversely, a slide below the October 9 low of 1.1542 would likely see the August low around 1.1400 acting as a key support zone for the pair.
Understanding the S&P Global Services PMI
The S&P Global Services Purchasing Managers’ Index (PMI) is a crucial monthly indicator that gauges business activity within the US services sector. Given that the services sector constitutes a significant portion of the US economy, the Services PMI serves as an important measure of overall economic conditions.
The data is compiled from surveys sent to senior executives at private-sector companies operating within the services industry. These survey responses reflect changes in business activity compared to the preceding month and can offer predictive insights into trends observed in official economic data, such as Gross Domestic Product (GDP), industrial production, employment figures, and inflation.
✅ A reading above 50 typically indicates expansion in the services economy, which is generally considered a bullish signal for the US Dollar (USD). Conversely, a reading below 50 suggests a decline in activity among service providers, which is viewed as bearish for the USD.
The next release of the S&P Global Services PMI is scheduled for Friday, October 24, 2025, at 13:45 GMT, with a preliminary reading expected. The consensus forecast for this release is 53.5. The frequency of this report is monthly, and the previous reading was 54.2.
Final Thoughts
The latest S&P Global PMI data indicates a strong start to the fourth quarter for the US private sector, with notable growth in both manufacturing and services. While the dollar showed a muted reaction, the positive economic indicators suggest continued underlying strength.