

Key Takeaways
- The USD/JPY currency pair has shown an uptrend since April, with potential for modest further gains.
- The Bank of Japan’s upcoming meeting might introduce hawkish sentiment, potentially reversing the current trend.
- Significant unfilled price gaps on the spot market could attract prices, possibly initiating a trend reversal upon being filled.
- The analysis utilizes Elliott Wave theory, specifically Ending Diagonals, to forecast price movements and potential reversals.
USD/JPY Trend Analysis
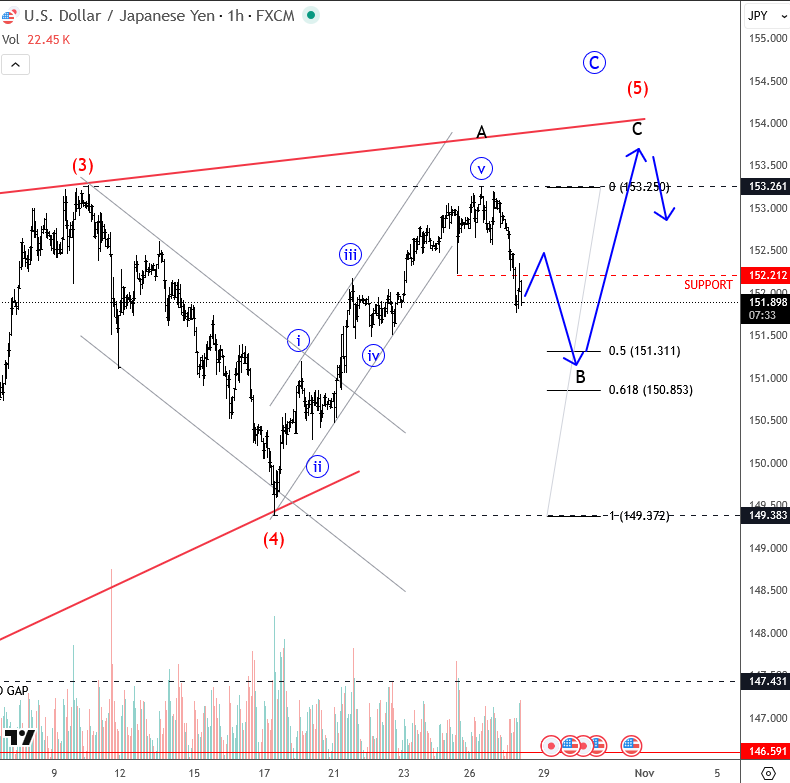
The USD/JPY currency pair has sustained an upward trend since its April lows. Current technical indicators suggest the potential for further modest gains. This projection is based on the Elliott Wave principle that each sub-wave within an ending diagonal pattern is typically composed of three waves.
The current price action indicates a continued move toward the significant resistance zone located between 154 and 155. While the prevailing geopolitical climate has influenced the recent upward momentum, traders are increasingly focused on the Bank of Japan’s forthcoming monetary policy meeting.
Potential for Trend Reversal
Any hawkish signals emerging from the Bank of Japan could dramatically alter the existing trend, potentially triggering a sharp reversal and a subsequent downturn in the USD/JPY pair. This upcoming meeting represents a critical juncture for the currency pair’s trajectory.
A crucial technical factor to monitor is the presence of substantial unfilled price gaps on the spot market. These gaps represent areas where a notable volume of buy or sell orders remains unexecuted. Historically, such gaps can act as strong price magnets, drawing the exchange rate toward them.
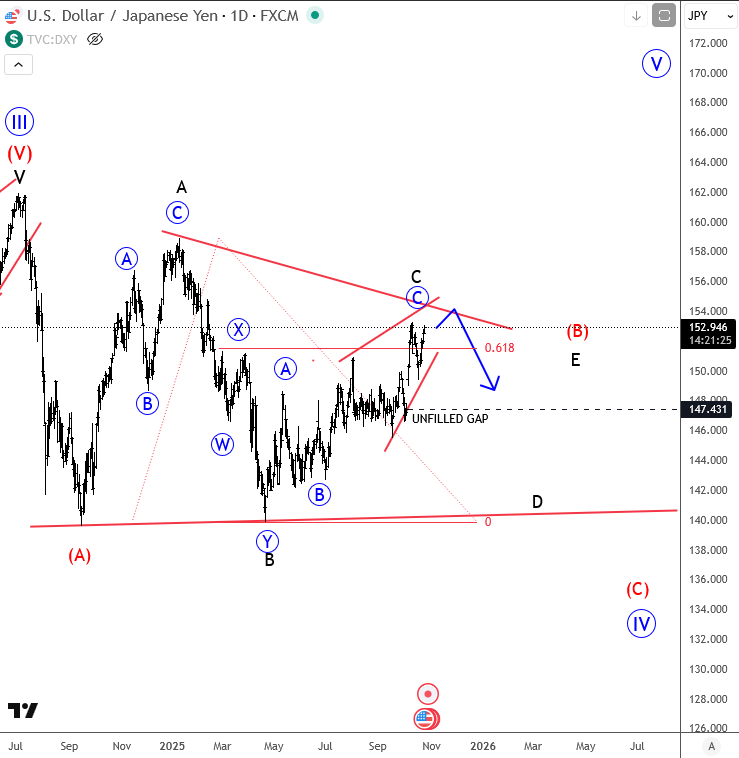
Once these gaps are filled, the resulting executed orders could instigate a reversal, potentially leading to a change in the established trend direction. For the moment, the prevailing analysis suggests that USD/JPY is approaching a significant resistance area, strongly influenced by current chart patterns and the possibility of external factors disrupting the existing trend.
Understanding Elliott Wave Ending Diagonals
To provide a clearer picture of the technical analysis, a brief educational overview of ending diagonals is presented.
What Constitutes an Ending Diagonal?
- An Ending Diagonal (ED) is a specific pattern within Elliott Wave theory, typically observed as the fifth wave of an impulse wave or the ‘C’ wave of a corrective pattern.
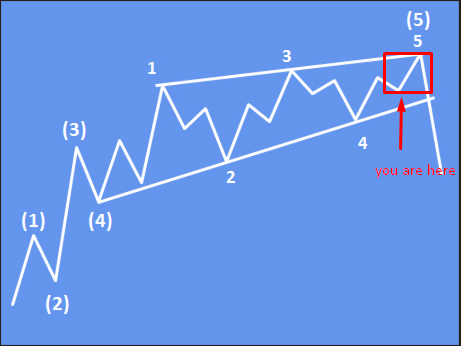
- This pattern signifies a potential exhaustion of the current trend. It is characterized by diminishing momentum as prices continue to move within a contracting wedge formation.
- Unlike standard impulse waves, all sub-waves within an Ending Diagonal (waves 1 through 5) are generally formed by three-wave structures (zigzags), resulting in a 3-3-3-3-3 subdivision. A key distinguishing feature is that wave 4 frequently overlaps with wave 1.
- The completion of an Ending Diagonal frequently precedes a sharp and sudden market reversal.
Fibonacci Relationships within Ending Diagonals
- Wave 2 typically retraces between 61.8% and 78.6% of wave 1.
- Wave 3 often extends to Fibonacci levels between 61.8% and 100% of wave 1.
- Wave 4 commonly retraces between 50% and 78.6% of wave 3 and, crucially, overlaps wave 1.
- Wave 5 usually measures between 61.8% and 100% of wave 3, with potential extensions up to 1.236 times the length of wave 3 under stronger market conditions.
Expert Insights
The observed overlapping price action in USD/JPY suggests the potential formation of an ending diagonal pattern. While an uptrend has persisted since April, the confluence of technical signals and potential fundamental shifts, like a hawkish stance from the Bank of Japan, indicates that a reversal might be on the horizon.
The presence of significant unfilled gaps remains a critical factor that could draw prices higher before any potential downturn. Traders should monitor these levels closely as they may precipitate a sharp shift in market direction.