
Summary
- The past trading week saw mixed performance in major asset classes, with Gold and Silver experiencing significant gains, while Platinum and Palladium faced sharp declines.
- The primary market driver continues to be the escalating trade dispute between the US and China, alongside the looming threat of new tariffs set to take effect on November 1st.
- Economic data releases were limited due to the US government shutdown, though crucial inflation prints are anticipated.
- Currency markets showed volatility, particularly the Japanese Yen, influenced by trade tensions and safe-haven flows.
- Upcoming economic data includes key inflation reports from the US, UK, Canada, and New Zealand, alongside Purchasing Managers’ Index figures.
The past trading week presented a dynamic landscape for traders, featuring notable performance shifts across various markets. While Gold and Silver demonstrated robust upward momentum, Platinum and Palladium experienced considerable drawdowns. The overarching sentiment remains heavily influenced by the ongoing US-China trade conflict and the immediate deadline for new comprehensive tariffs, contributing to an environment of heightened market nervousness and volatility.
💡 The US government shutdown has significantly curtailed the release of economic data, creating uncertainty and potentially amplifying the impact of scheduled reports.
Last week’s key trading recommendations included: Long positions in Gold, which surged by 5.88%, and Silver, which saw a gain of 3.15%. A long trade recommendation for Platinum was contingent on a daily close above $1,666, which was set up but ultimately resulted in a 6.56% loss due to a Friday decline. Similarly, a proposed long trade for Palladium above $1,468, initiated on Monday, ended the week with a 0.60% loss. Collectively, these trades yielded an overall gain of 1.87%, averaging 0.47% per asset.
✅ Understanding the setup conditions and risk management is crucial, especially when dealing with volatile assets like precious metals.
Significant economic data released during the week included the UK GDP, showing a month-on-month increase of 0.1%, as broadly anticipated. In Australia, the Employment Change reported fewer new jobs than expected, and the Unemployment Rate unexpectedly climbed to 4.5% from 4.3%, though these figures had minimal impact on the Australian Dollar.
📊 Economic releases, even those with limited market impact, provide valuable context for understanding currency movements.
The dominant market themes were conspicuously detached from the week’s data releases. The primary concern remains the escalating trade dispute between the United States and China. President Trump’s announcement of a 100% tariff on all imports from China, effective November 1st, has injected significant uncertainty and volatility into the markets. Despite initial attempts to downplay the threat, market sentiment fluctuated based on pronouncements regarding potential concessions on rare earth exports in exchange for tariff flexibility.
📌 The interplay between geopolitical tensions and trade policies is a critical factor influencing global financial markets.
This trade dispute has contributed to notable declines in the US stock market, albeit with significant recovery later in the week. Concurrently, precious metals experienced sharp, sudden drops, though these movements may not be directly correlated with the trade war narrative.
⚡ Observing price action across different asset classes can reveal interconnectedness and diversified market reactions.
Japanese Yen Volatility and Trade Tensions
The Japanese Yen also exhibited considerable volatility, recording substantial gains early in the week before relinquishing much of its upward movement, particularly against commodity currencies. Japan’s Finance Minister, Katsunobu Kato, expressed concerns about excessive exchange-rate volatility that could harm the economy, suggesting an awareness of the potential for further Yen fluctuations leading up to the November 1st tariff deadline.
💡 The Yen’s role as a safe-haven asset means its value can be highly sensitive to shifts in global risk sentiment.
A significant sell-off in US stock markets could trigger a flight to the Yen, reinforcing its safe-haven status. Consequently, market participants will be closely monitoring President Trump’s statements regarding the trade dispute for directional cues throughout the coming week.
📍 Increased volatility in the Yen often signals heightened global economic uncertainty.
US Economic Data and Market Cues
The ongoing US government shutdown continues to limit the release of US economic data. However, a highly anticipated US CPI (inflation) report is scheduled. Any postponement of this release could lead to increased market speculation, as traders are seeking crucial economic indicators to guide their strategies.
✅ Crucial economic reports, like CPI, often act as significant catalysts for market movements.
The bullish trend in Gold has remained intact, but many trend followers were caught off guard by the sharp decline in Silver prices on Friday, which led to the exit of several long positions. Palladium also experienced a steep price drop.
📊 The resilience of Gold amidst broader precious metal weakness highlights its unique market dynamics.
The upcoming week is expected to witness heightened market activity, predominantly driven by the intensification of the US-China trade conflict. Scheduled high-impact economic data events are relatively scarce.
The most significant data releases anticipated for the coming week, in order of importance, are:
- US CPI (inflation)
- US, German, British Flash Services & Manufacturing PMI
- UK CPI (inflation)
- Canadian CPI (inflation)
- New Zealand CPI (inflation)
It is important to note that US data releases may be subject to indefinite postponement due to the ongoing government shutdown.

Currency Price Changes and Interest Rates
For October 2025, the EUR/USD currency pair was forecasted to increase in value. Its performance up to October 19th, 2025, is illustrated below.

October 2025 Monthly Forecast Performance to Date
No weekly forecast was issued for the previous week.
While currency pairs experienced more significant price movements two weeks prior, last week saw no unusually large shifts in major currency crosses, resulting in no new weekly forecast.
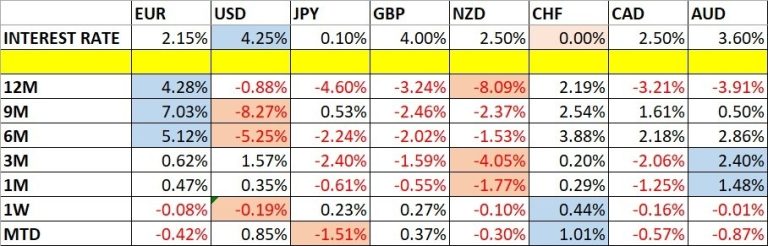
The Swiss Franc emerged as the strongest major currency last week, while the US Dollar was the weakest, although the percentage changes were minimal. Directional volatility was notably low compared to the preceding week, with no major pairs or crosses deviating by more than 1%.
📍 Increased volatility is anticipated in the Forex market during the upcoming week.
The image below displays key support and resistance levels relevant for trading analysis:

Key Support and Resistance Levels
Last week, the US Dollar Index formed a bearish inside bar pattern on its weekly chart, characterized by significant upper and lower wicks. Crucially, the price again rejected the key resistance level at 98.60. A sustained breakout above this level could signal the start of a major long-term upward trend for the US Dollar, especially given that current price levels are above those seen 13 weeks ago, indicating a potential end to the long-term bearish trend.
✅ A break above key resistance, especially with historical context, can signify a significant trend reversal.
The US Dollar’s trajectory in the coming days may be influenced by China’s response to the proposed rare earth export restrictions and President Trump’s 100% tariff threat. This situation is creating more predictable price action in currencies like the Australian and New Zealand Dollars, which are closely linked to the Chinese economy, and the Japanese Yen, currently favored as a safe-haven currency. The Canadian Dollar, acting as a proxy for crude oil prices, is also susceptible to shifts in risk appetite.
📌 Developing an understanding of currency correlations can enhance trading strategies.

US Dollar Index Weekly Price Chart
The USD/JPY currency pair’s weekly chart displayed a large, bearish inside candlestick. However, this pattern is viewed as indecisive rather than strongly bearish. The pair is supported by a long-term bullish trend, recently reconfirmed by a breakout to a new six-month high, a pattern historically associated with trend-following advantages.
The primary driver for USD/JPY remains the Yen’s sensitivity to global risk sentiment, particularly concerning the US-China trade landscape. A resolution or de-escalation of the tariff dispute could lead to a significant upward move in USD/JPY. Conversely, the imposition of tariffs would likely result in strong price depreciation. Despite the trend, the pair’s movement is currently at the mercy of political developments.
📍 Predicting currency pair movements requires monitoring both technical patterns and geopolitical events.
The long-term consolidating triangle pattern, indicated by trend lines on the price chart, suggests that a bullish breakout could target the ¥155 level.

USD/JPY Weekly Price Chart
Following a sharp decline the previous week after the US announced its tariff strategy against China, price action for the S&P 500 Index exhibited weakly bullish behavior throughout most of the past week. This suggests that market risk appetite has remained relatively stable, though not exceptionally strong. The index’s price is not far from the all-time high reached in the prior week.
The short-term outlook for the S&P 500 will likely depend on the resolution of the US-China trade dispute and China’s rare earth export policies. A favorable outcome, such as the removal of tariffs, could drive the stock market to new all-time highs. Conversely, a worsening trade situation could lead to substantial market declines, particularly if the 100% tariff is imposed as threatened.
✅ Monitoring potential trade deal outcomes is essential for assessing the direction of major stock indices.
The recommendation is to remain long, with new long positions advised only after a new record high daily close at or above 6,766.

S&P 500 Index Weekly Price Chart
The analysis for the S&P 500 Index is also applicable to the NASDAQ 100 Index. Notably, the NASDAQ 100 outperformed the S&P 500 last week, and its price chart appears more bullish, with its weekly close nearing its recent all-time high.
This outperformance by the tech-heavy index suggests that market participants anticipate a favorable resolution to China’s rare earth export discussions.
💡 Sector-specific strength can often signal underlying market sentiment regarding trade negotiations.
The recommendation is to remain long in the NASDAQ 100, with new long positions advised only after a new record high daily close at or above 25,187.

NASDAQ 100 Index Weekly Price Chart
Gold experienced another significant surge last week, at one point rising over 7% to achieve a new all-time high before settling for a weekly gain exceeding 5%. This represents one of the largest weekly increases for Gold in recent times.
While the established long-term bullish trend and the break to new record highs are positive indicators, the sharp declines observed in Silver and Palladium, coupled with extreme recent volatility, might suggest an approaching climax to this bullish trend. The question remains how much further Gold can appreciate after such substantial gains.
✅ Gold’s performance relative to other precious metals indicates its unique appeal as a safe-haven asset.
A key bullish factor is that Gold has demonstrated greater resilience compared to other precious metals. The recommendation is to remain bullish on Gold, with new long positions advised only after a new all-time record high close in New York, at or above $4,326.

XAU/USD Weekly Price Chart
In a particularly volatile week, Silver saw its price close at a new record high weekly closing price, only to fall significantly within a single day, causing many trend traders to exit their profitable multi-month long positions. The high volatility and generally erratic nature of Silver’s price movements warrant careful consideration. Notably, other precious metals, including Palladium, also experienced sharp declines on Friday.
While some traders may maintain long positions, there are indications that new highs may not be imminent, although a weaker bullish move is still possible in the near term.
📌 Respecting significant price reversals is a critical aspect of managing risk in volatile markets.
The recommendation is to exit existing long trades. New long positions would only be considered if the price achieves a daily close in New York at or above $54.25, and even then, optimism would be moderate.

XAG/USD Weekly Price Chart
Platinum’s price action mirrored that of Silver last week. It reached a new long-term high on Thursday and closed strongly, only to experience a substantial decline on Friday, similar to Silver. The bearish move on Friday for Platinum was particularly pronounced, as the price closed near its lows without any late recovery.
The weekly price chart shows bearish price action, which becomes more evident when examining the daily chart. This reveals two consecutive bearish pin bars at the week’s end. The weekly chart itself also displays a bearish pin bar. This multi-time frame confluence of bearish signals can be a potent short-term indicator, contributing to a lack of confidence in the existing long trade.
💡 Analyzing multiple time frames can uncover subtle yet significant trading signals.
Friday’s decline was substantial, nearing 3X the Average True Range (100), a common stop-loss level for trend followers. Thus, the existing long position is held, with the expectation of being stopped out on Monday. Platinum has experienced a strong run recently, likely supported by the robust long-term bull markets in Gold and Silver.
📊 The correlation between precious metals can provide insights into overall market sentiment for the sector.
Entering a new long trade is advisable only if another long-term high New York close is achieved at or above $1,716. However, even under such conditions, confidence in the trade’s profitability would be limited.
For traders without direct access to Platinum futures or whose contract sizes are too large, a Platinum ETF (PPLT) offers an alternative avenue for exposure.

XPT/USD Weekly Price Chart
This week’s best trading opportunities are identified as:
- Long position in the USD/JPY currency pair, following a New York close above ¥153.08.
- Long position in Gold, following a daily (New York) close above $4,326.
- Long position in Silver, using a small position size, following a daily (New York) close above $54.25.
- Long position in Platinum, using a small position size, following a daily (New York) close above $1,716.
- Long position in the NASDAQ 100 Index, following a daily (New York) close at or above 25,187.
- Long position in the S&P 500 Index, following a daily (New York) close at or above 6,766.
Fundfa Insight
The upcoming trading week is poised for increased volatility, largely driven by the geopolitical tensions surrounding the US-China trade dispute and the impending tariff implementation. While Gold shows resilience, other precious metals and select indices present specific opportunities and risks contingent on technical setups and the unfolding trade narrative.